I’m pretty busy this week so I was hoping not to dive into the Box S-1, but David Cummings’ excellent summary served only to whet, as opposed to satiate, my appetite.
Perhaps it was the $168M FY14 operating loss. Maybe it was the $380M in financing raised during the last three years. Or the average quarterly burn rate of $23M. But somehow, I got sucked in.
I just had to know their CAC ratio. Of course, it’s not going to be easy to calculate. While they give us quarterly S&M expense, that’s only half the equation; we’re going to have a figure out –as best we can — quarterly new annual recurring revenue (ARR).
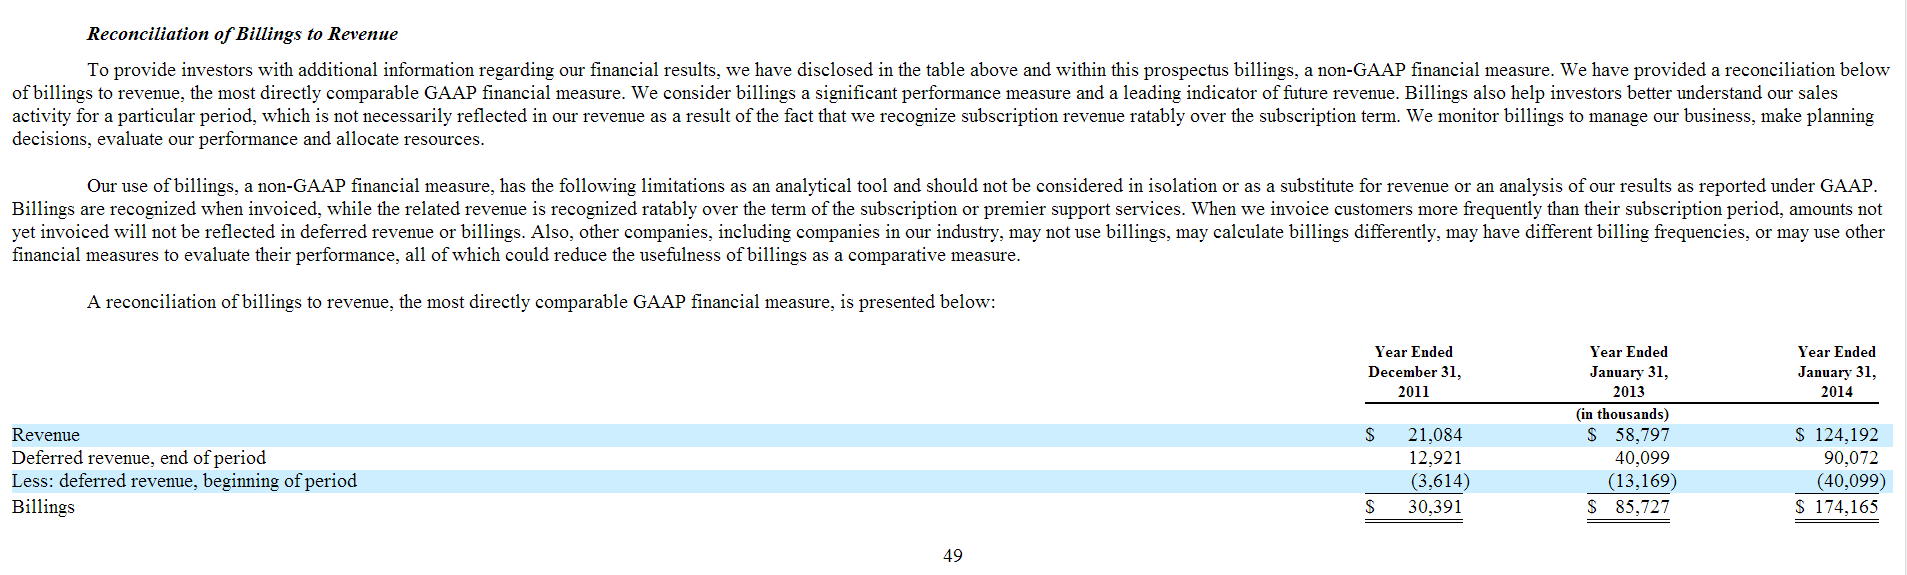
Billings as a Sales Metric
While many SaaS companies don’t disclose “billings,” Box does — but on an annual basis only — in their S-1.
[Click on the images to see full size.]
..
Billings is an attempt to triangulate on new sales (or bookings) in a SaaS company. The standard way to calculate billings is to add revenue plus change in deferred revenue.
The idea is that if you want to know how “sales” went during a given period, then revenue is not a great indicator because, in a SaaS company, revenue is an indicator of how much you sold in prior periods, not the current one. So you look at deferred revenue trying to pick up the volume of new orders. The problem is that things quickly get very complicated because (1) deferred revenue is moving both down (as past deals convert into revenue) and up (as new deals are signed) and (2) deferred revenue itself is limited only to deals that are prepaid — if a company does a constant business volume but suddenly starts doing a lot of two-year prepaids, then deferred revenue will skyrocket and if, for example, hard economic times drive loyal customers to ask for bi-annual billing, then deferred revenue will plummet, all without any “real” change in underlying subscription business. In addition, multi-year non-prepaid deals are invisible from a deferred revenue perspective (because there’s nothing, i.e., no cash prepayment, to defer).
In short, any metric built upon deferred revenue is only as a good as deferred revenue at reflecting the business.
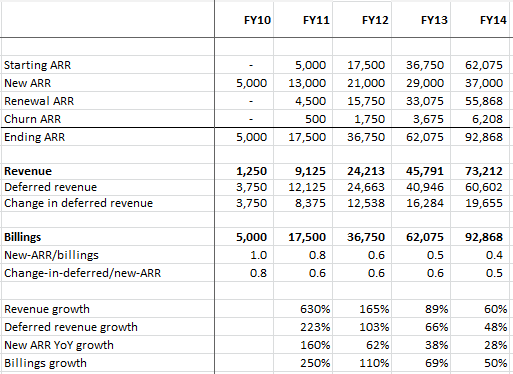
To demonstrate the relationship between billings and new ARR, I built a model which assumes a SaaS company that starts from scratch, increases new ARR added each quarter by $500K (i.e., $500K in its first quarter, $1M in its second, $1.5M in its third), does only one-year prepaid deals, and has a 90% renewal rate. Here’s what happens.
(You can download the spreadsheet with Box financial summary and the full version of the model here. Be sure to download as an Excel file, not a PDF.)
..
While in year one, billings is equivalent to new ARR, as you build up the renewals base, it contributes more to revenue and muddies thing up. For a company of the above size, growth, and renewal rate, the ratio of new ARR to billings ends up 0.4.
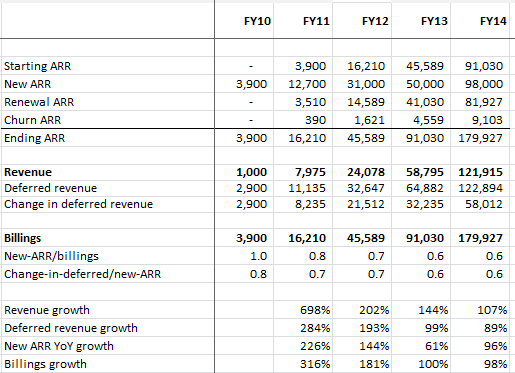
When you take this same model and (manually) force fit the new ARR numbers to try approximate Box’s revenue and billings from 2012-2014, you get:
..
A CAC of ~1.6
In this case (and given my assumption set) you end up with a new-ARR/billings ratio of 0.6. To make life easier, I also calculated a new-ARR/revenue ratio (see the full sheet), which ends up around 0.8. I’ll use to this number to calculate my CAC, which comes out to between 1.5 and 1.8. While not quite an idyllic 1.o to 1.2, it’s well below 2.0 and helps explain why Box has been able to raise so much money: their growth has been deemed scalable.
Billings = Ending ARR
In reviewing my models, it’s hard not to notice that billings for a period equals ending ARR for that period. This turns out to be true under my assumption set of subscription-only (no services), one-year deals only, and everything pre-paid. Why? Because for any deal taken at any point during the year, we will recognize some percent of it (X) and the rest (Y) will go to deferred revenue. The difference between X and Y changes across the year but X+Y= the deal size at all times.
This is not true when you have consulting or do multi-year prepaid deals (which can make billings > ending ARR). It’s also not true when you do semi-annual billing (which can make billings < ending ARR).
If you assume for any given company that these factors are roughly constant, then even though uniformly inaccurate, it does provide a simple way to approximate new ARR: take the difference in ending ARR two periods, add a churn assumption, and bang you have new ARR during the period.
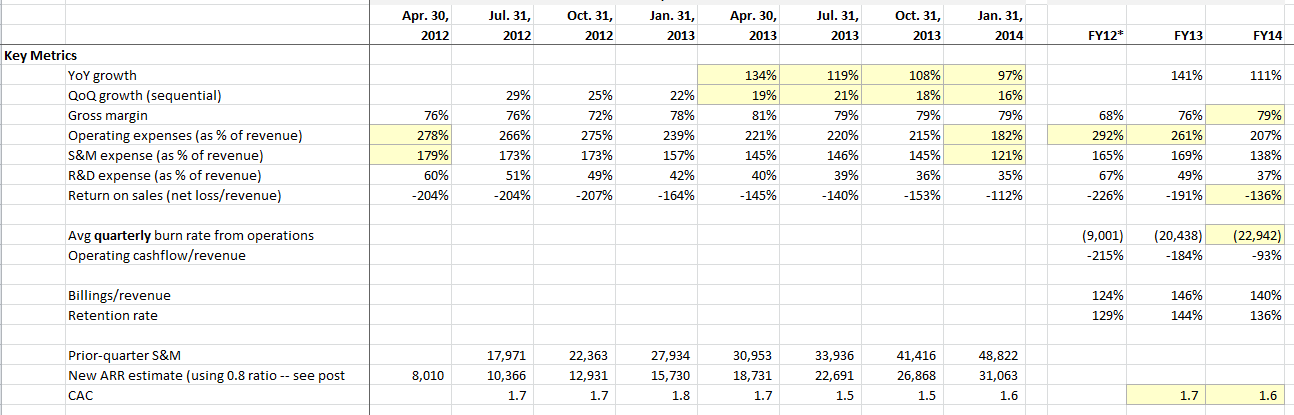
Key Metrics, Cashflow, and the P&L
Here are some summarized key metrics (using yellow to highlight points of interest).
..
Of note:
- Year over year growth, while high at 97% is slowly decelerating.
- Gross margins are nice at nearly 80%
- Operating expenses are massive: 278% of sales in 1Q12 down to “only” 182% in 4Q14.
- S&M expense are a seemingly very high 121% of revenues. This looks bad, but to really know what’s going on we need to examine the CAC, which looks pretty good.
- Return on sales is -112%
- That burn rate sure grabs you: $22M per quarter
In many ways you see a typical “go big or go home” cloud computing firm, burning boatloads of cash but acquiring customers in a reasonably efficient manner and doing a nice job with retention/cross-sell/up-sell as judged by their retention numbers. When you look big picture, I believe they see themselves in a winner-take-all battle vs. DropBox and in this case, the strategy — while amazingly cash consumptive — does make sense.
Here is a look at cashflow and billings:

..
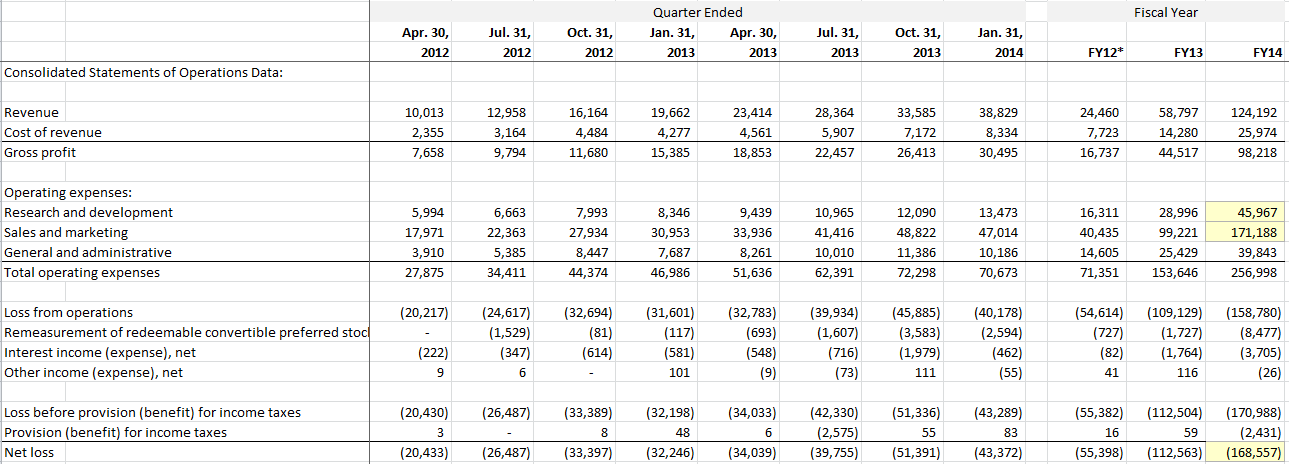
And last, but certainly not least, here is the P&L:
..
Of note:
- I’m always amazed by the R&D spend of seemingly simple consumer services. They spent $46M in R&D last year … on what?
- The $171M in S&M expense sure grabs your attention
- As does the $168M net loss!
[Revised and expanded 3/27/14 9:18 AM]
# # #
I am not a financial analyst. I do not make buy, sell, or hold recommendations on stocks. See my FAQ for affiliations and disclaimers.


Pingback: RedTrack.ME
Quick note — in one of my prior companies they used to bill all ‘software developer’ salaries and related expenses as R&D as they’re “researching and developing new approaches for the existing product”.
Take from that what you will.
Great detailed analysis.
What are your thoughts on their low (IMO) ACV of $3600 per client? They forecast future ACV growth of ~42% using a cohort of their 2010 customers. However they cite that 3 customers contributed significantly to that growth.
So is Box’s claim that they are buying the market and the growth will follow skewed by their anemic sales numbers?
The retention numbers, along with my estimated CAC, seem to indicate that [1] they are buying customers, [2] those customers are annuities, and [3] those annuities increase (ok — technically an annuity is a stream of equal payments but you get the idea) over time, and not insignificantly. Call me brainwashed, but looking at the GAAP P&L shocked me as much as anyone, but when you look at real drivers like CAC and retention, they seem to be doing pretty well.
Pingback: Box, Microsoft, and the Next Enterprise Platform | stratēchery by Ben Thompson
Awesome analysis, Dave. I’d be curious to see if Salesforce had a similar ramp in the early days. The question then would be whether Box “annuities” will be as sticky as those of Salesforce. I believe the answer is no.
I love the detail and perspective – I’ll be an avid follower from now on!
Pingback: With IPO Hopes Fading, Square And Box Face Reality Of Commodity Products | TechCrunch
Pingback: With IPO Hopes Fading, Square And Box Face Reality Of Commodity Products | infoscape.com
Pingback: With IPO Hopes Fading, Square And Box Face Reality Of Commodity Products | geekville.com
Pingback: With IPO Hopes Fading, Square And Box Face Reality Of Commodity Products | webguide.net
Pingback: With IPO Hopes Fading, Square And Box Face Reality Of Commodity Products | Sharing Interesting Stuff, Updates News & Free Tips
Pingback: With IPO Hopes Fading, Square And Box Face Reality Of Commodity Products | AkimoLux.com
Pingback: The Box S-1, Delayed IPO, and the Genius of Tien Zuo | Kellblog
Pingback: With IPO Hopes Fading, Square And Box Face Reality Of Commodity Products – TechCrunch