Churn: Net-First or Sum-First?
****
Please note that this post has been superseded by A Fresh Look at How to Measure SaaS Churn Rates. I'm leaving it posted to protect in-bound links only and to provide a referral to my latest material on this subject.
****
While I've already done a comprehensive post on the subject of churn in SaaS companies and some perils in how companies analyze it, in talking with fellow SaaS metrics lovers of late, I've discovered a new problem that isn't addressed by my posts.
The question? When calculating churn, should you sum first (adding up all the shrinkage ARR) or net first (net shrinkage vs. expansion ARR and then sum that). It seems like a simple question, but like so many subtitles in SaaS metrics, whether you net-first or sum-first, and how you report in so doing, can make a big difference in how you see the business through the numbers.
Let's see an example.
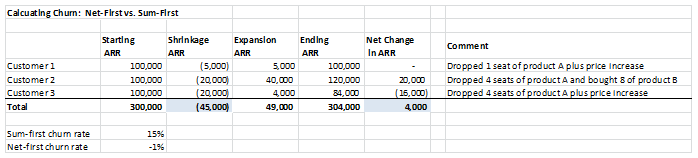
So what’s our churn rate: a healthy -1% or a scary 15%? The answer is both. In my other post, I define about 5 churn rates, and when you sum first you get my “net ARR churn” rate [1], which comes in at a rather disturbing 15%. When, however, you net first you end up a healthy -1% (“gross ARR churn”) rate because expansion ARR has more than offset shrinkage. At my company we track both rates because each tells you a different story.
Thanks to the wonders of math, both the net-first and sum-first calculations take you to the same ending ARR number. That’s not the problem.
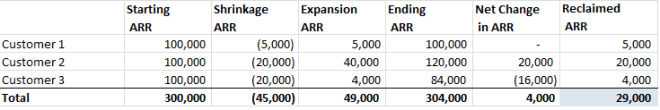
The problem is that many companies report churn in a format not like my table above, but in something simpler like that looks like this below [2].

As you can see, this net-first format doesn't show expansion and shrinkage by customer. I think this is dangerous because it can obscure real problems when shrinkage ARR is offset, or more than offset, by expansion ARR.
For example, customer 2 looks great in the second chart (“wow, $20K in negative churn!”). In the first chart, however, you can see customer dropped 4 seats of product A and more than offset that by buying 8 seats of product B. In fact, in the first chart, you can see that everyone is dropping product A and buying product B which is hidden in the second chart that neither breaks out shrinkage from expansion nor provides a comment as to what’s going on. My advice is simple: do sum-first churn and report both the “net ARR” and “gross ARR” renewal rates and you’ll get the whole picture.
Aside 1: The Reclaimed ARR Issue
This debate prompted a second one with my Customers For Life (CFL) team who wanted to introduce a new metric called “reclaimed ARR,” the ARR that would have been lost on renewal but was saved by CFL through cross-sells, up-sells, and price increases. Thus far, I’m not in love with the concept as it adds complexity, but I understand why they like it and you can see how I’d calculate it below.
Aside 2: Saved ARR
The first aside was prompted by the fact that CFL/renewals teams primarily play defense, not offense. Like goalies on a hockey team, they get measured by a negative metric (i.e., the churn ARR that got away). Even when they deliver offsetting expansion ARR, there is still some ARR that gets away, and a lot of their work (in the customer support and customer success parts of CFL) is not about offsetting-upsell, it’s about protecting the core of the renewal. For that reason, so as to reflect that important work in our metrics, we've taken a lesson from baseball and the notion of a “save.” Once the renewals come in, we add up all the ARR that came from customers who were, at any point in time since their last renewal, in our escalated accounts program and call that Saved ARR. It’s best metric we've found thus far to reflect that important work.
#
[1] I have backed into the rather unfortunate position of using the word “net” in two different ways. When I say “net ARR churn” I mean churn ARR net of (i.e., exclusive of) expansion ARR. When I say net-first churn, I meant to net-out shrinkage vs. expansion first, before summing the customers to get total churn.
[2] Note that I properly inverted the sign because negative churn is good and positive churn is bad.