Using Pipeline Conversion Rates as Triangulation Forecasts
In this post we'll examine how we to use pipeline conversion rates as early indicators of your business performance.
I call such indicators triangulation forecasts because they help the CEO and CFO get data points, in addition to the official VP of Sales forecast, that help triangulate where the company is going to land. Here are some additional triangulation forecasts you can use.
- Salesrep-level forecast (aggregate of every salesperson's forecast)
- Manager-level forecast (aggregate of the every sales manager's forecast)
- Stage-weighted expected value of the pipeline, which takes each opportunity and multiplies it by a stage- and ideally time-specific weight (e.g., week 6 stage 4 conversion rate)
- Forecast-category-weighted expected value of the pipeline, which does the same thing relying on forecast category rather than stage (e.g., week 7 upside category conversion rate)
With these triangulation forecasts you can, as the old Russian proverb goes, trust but verify what the VP of sales is telling you. (A good VP of sales uses them as part of making his/her forecast as well.)
Before looking at pipeline conversion rates, let me remind you that pipeline analysis is a castle built on a quicksand foundation if your pipeline is not built up from:
- A consistent, documented, enforced set of rules for how opportunities are entered into the pipeline including, e.g., stage definitions and valuation rules.
- A consistent, documented, enforced process for how that pipeline is periodically scrubbed to ensure its cleanliness. [1]
Once you have such a pipeline, the first thing you should do is to analyze how much of it you convert each quarter.
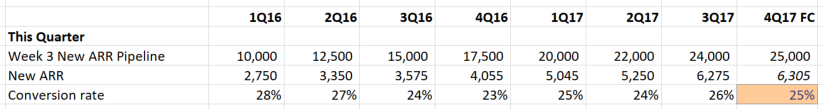
This helps you not only determine your ideal pipeline coverage ratio (the inverse of the conversion rate, or about 4.0x in this case), but also helps you get a triangulation forecast on the current quarter. If we're in 4Q17 and we had $25,000K in new ARR pipeline at week 3, then using our trailing seven quarter (T7Q) average conversion rate of 25%, we can forecast landing at $6,305K in new ARR.
Some folks use different conversion rates for forecasting -- e.g., those in seasonal businesses with a lot of history might use the average of the last three year's fourth-quarter conversion rate. A company that brought in a new sales VP five quarters ago might use an average conversion rate, but only from the five quarters in her era.
This technique isn't restricted to this quarter's pipeline. One great way to get sales focus on cleaning next quarter's pipeline is to do the same analysis on next-quarter pipeline conversion as well.
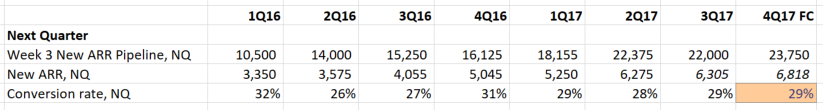
This analysis suggests we're teed up to do $6,818K in 1Q18, useful to know as an early indicator at week 3 of 4Q17 (i.e., mid/late October).
At most companies the $6,305K prediction for 4Q17 new ARR will be pretty accurate. However, a strange thing happens at some companies: while you end up closing around $6,300K in new ARR, a fairly large chunk of the closed deals can't be found in the week 3 pipeline. While some sales managers view this as normal, better ones view this as a sign of potentially large problem. To understand the extent to which this is happening, you need perform this analysis:
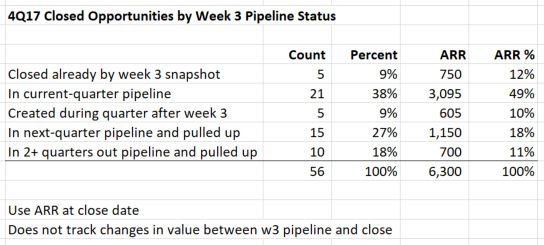
In this example, you can see a pretty disturbing fact -- while the company "converted" the week 3 ARR pipeline at the average rate, more than half of the opportunities that closed during the quarter (30 out of 56) were not present in the week 3 pipeline [2]. Of those, 5 were created after week 3 and closed during the quarter, which is presumably good. However, 25 were pulled in from next quarter, or the quarter after that, which suggests that close dates are being sandbagged in the system.
Notes
[1] I am not a big believer in the some sales managers "always be scrubbing" philosophy for two reasons: "always scrubbing" all too often translates to "never scrubbing" and "always scrubbing" can also translate to "randomly scrubbing" which makes it very hard to do analytics. I believe sales should formally scrub the pipeline prior to weeks 3, 6, and 9. This gives them enough time to clean up after the end of a quarter and provides three solid anchor points on which we can do analytics.
[2] Technically the first category, "closed already by week 3" won't appear in the week 3 pipeline so there is an argument, particularly in companies where week 1-2 sales are highly volatile, to do the analysis on a to-go basis.