The Leaky Bucket, Net New ARR, and the SaaS Growth Efficiency Index
My ears always perk up when I hear someone say "net new ARR" -- because I'm trying to figure out which, of typically two, ways they are using the term:
- To mean ARR from net new customers, in which case, I don't know why they need the word "net" in there. I call this new business ARR (sometimes abbreviated to newbiz ARR), and we'll discuss this more down below.
- To mean net change in ARR during a period, meaning for example, if you sold $2,000K of new ARR and churned $400K during a given quarter, that net new ARR would be $1,600K. This is the correct way to use this term.
Let's do a quick review of what I call leaky bucket analysis. Think of a SaaS company as a leaky bucket full of ARR.
- Every quarter, sales dumps new ARR into the bucket.
- Every quarter, customer success does its best to keep water from leaking out.
Net new ARR is the change in the water level of the bucket. Is it a useful metric? Yes and no. On the yes side:
- Sometimes it's all you get. For public companies that either release (or where analysts impute) ARR, it's all you get. You can't see the full leaky bucket analysis.
- It's useful for measuring overall growth efficiency with metrics like cash burn per dollar of net new ARR or S&M expense per dollar of net new ARR. Recall that customer acquisition cost (CAC) focuses only on sales efficiency and won't detect the situation where it's cheap to add new ARR only to have it immediately leak out.
If I were to define an overall SaaS growth efficiency index (GEI), I wouldn't do it the way Zuora does (which is effectively an extra-loaded CAC), I would define it as:
Growth efficiency index = -1 * (cashflow from operations) / (net new ARR)
In English, how much cash are you burning to generate a dollar of net new ARR. I like this because it's very macro. I don't care if you're burning cash as a result of inefficient sales, high churn, big professional services losses, or high R&D investment. I just want to know how much cash you're burning to make the water level move up by one dollar.
So we can see already that net new ARR is already a useful metric, if a sometimes confused term. However, on the no side, here's what I don't like about it.
- Like any compound metric, as they say at French railroad crossings, un train peut en cacher un autre (one train can hide another). This means that while net new ARR can highlight a problem you won't immediately know where to go fix it -- is weak net new ARR driven by a sales problem (poor new ARR), a product-driven churn problem, a customer-success-driven churn problem, or all three?
Finally, let's end this post by taking a look and then a deeper look at the SaaS leaky bucket and how I think it's best presented.
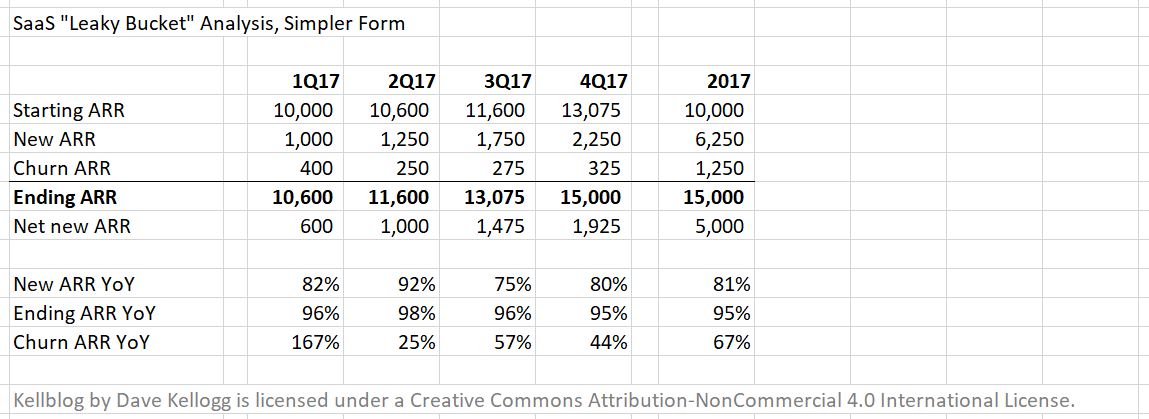
For example, above, you can quickly see that a massive 167% year-over-year increase in churn ARR was the cause for weak 1Q17 net new ARR. While this format is clear and simple, one disadvantage of this simpler format is that it hides the difference between new ARR from new customers (newbiz ARR) and new ARR from existing customers (upsell ARR). Since that can be an important distinction (as struggling sales teams often over-rely on sales to existing customers), this slightly more complex form breaks that out as well.
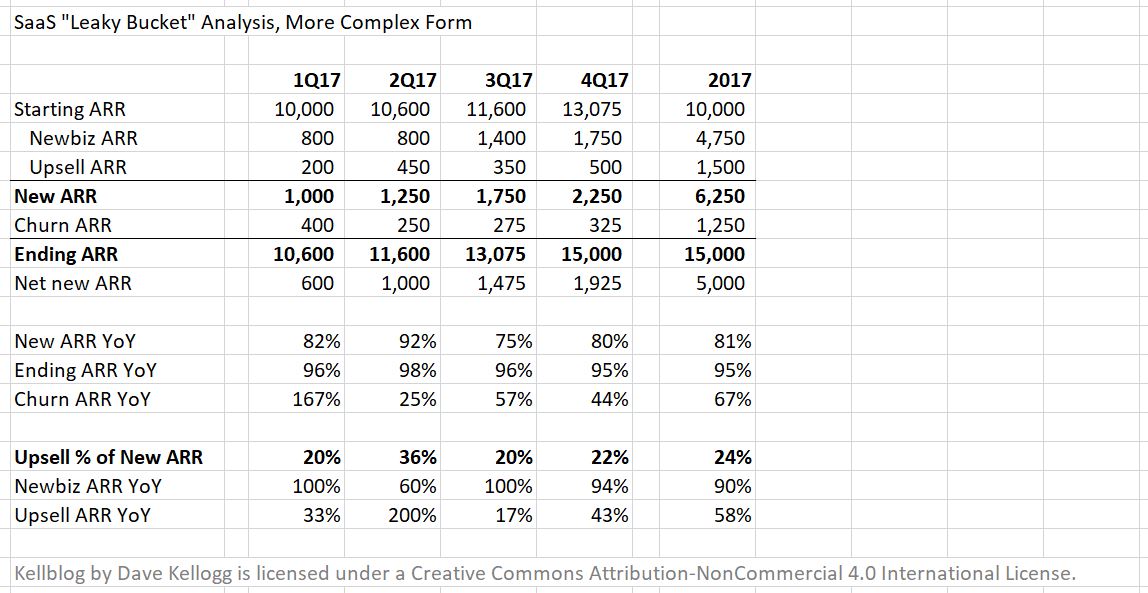
In addition to breaking out new ARR into its two sub-types, this format adds three rows of percentages, the most important of which is upsell % of new ARR, which shows to what extent your new ARR is coming from existing versus new customers. While the "correct" value will vary as a function of your market, your business model, and your evolutionary phase, I generally believe that figures below 20% indicate that you may be failing to adequately monetize your installed base and figures above 40% indicate that you are not getting enough new business and the sales force may be too huddled around existing customers.