The Use of Ramped Rep Equivalents (RREs) in Sales Analytics and Modeling
How many times have you heard this conversation?
VC: how many sales reps do you have?
CEO: Uh, 25. But not really.
VC: What do you mean, not really?
CEO: Well, some of them are new and not fully productive yet.
VC: How long does it take for them to fully ramp?
CEO: Well, to full productivity, four quarters.
VC: So how many fully-ramped reps do you have?
CEO: 9 fully ramped, but we have 15 in various stages of ramping, and 1 who's brand new ...
There’s a better way to have this conversation, to perform your sales analytics, and to build your bookings capacity waterfall model. That better way involves creating a new metric called ramped rep equivalents (RREs). Let’s build up to talking about RREs by first looking at a classical sales bookings waterfall model.
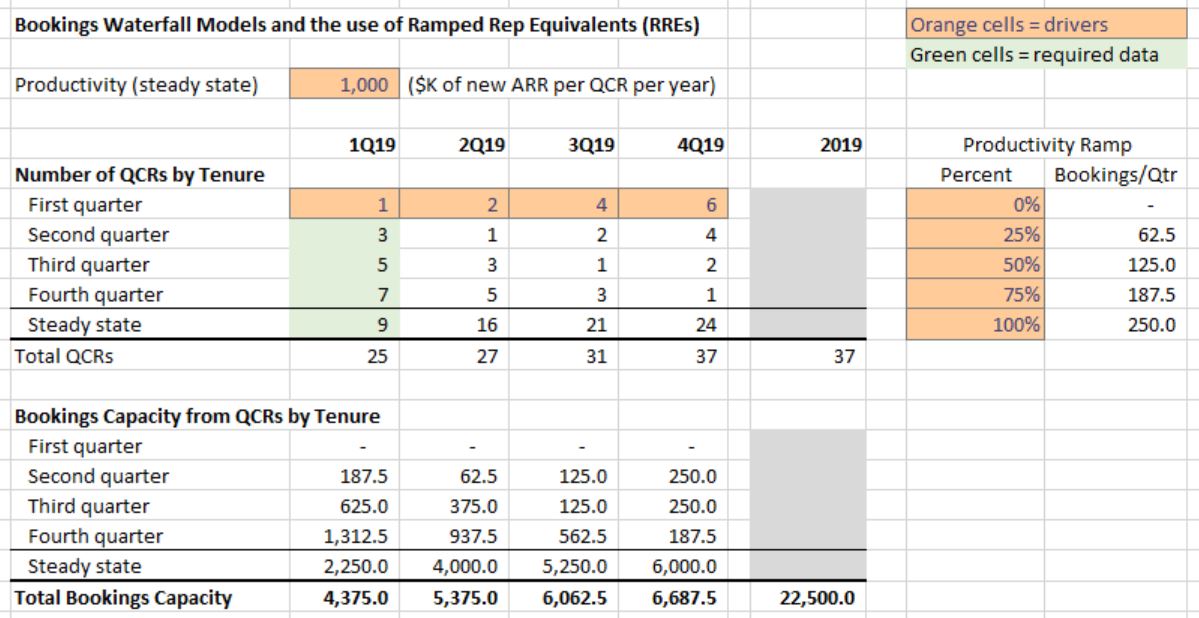
I love building these models and they're a lot of fun to play with, doing what-if analysis, varying the drivers (which are in the orange cells) and looking at the results. This is a simplified version of what most sales VPs look at when trying to decide next year's hiring, next year's quotas [1], and next year's targets. This model assumes one type of salesrep [2]; a distribution of existing reps by tenure as 1 first-quarter, 3 second-quarter, 5 third-quarter, 7 fourth-quarter, and 9 steady-state reps; a hiring pattern of 1, 2, 4, 6 reps across the four quarters of 2019; and a salesrep productivity ramp whereby reps are expected to sell 0% of steady-state productivity in their first quarter with the company, and then 25%, 50%, 75% in quarters 2 through 4 and then become fully productive at quarter 5, selling at the steady-state productivity level of $1,000K in new ARR per year [3].
Using this model, a typical sales VP -- provided they believed the productivity assumptions [4] and that they could realistically set quotas about 20% above the target productivity -- would typically sign up for around a $22M new ARR bookings target for the coming year.
While these models work just fine, I have always felt like the second block (bookings capacity by tenure), while needed for intermediate calculations, is not terribly meaningful by itself. The lost opportunity here is that we're not creating any concept to more easily think about, discuss, and analyze the productivity we get from reps as they ramp.
Enter the Ramped Rep Equivalent (RRE)
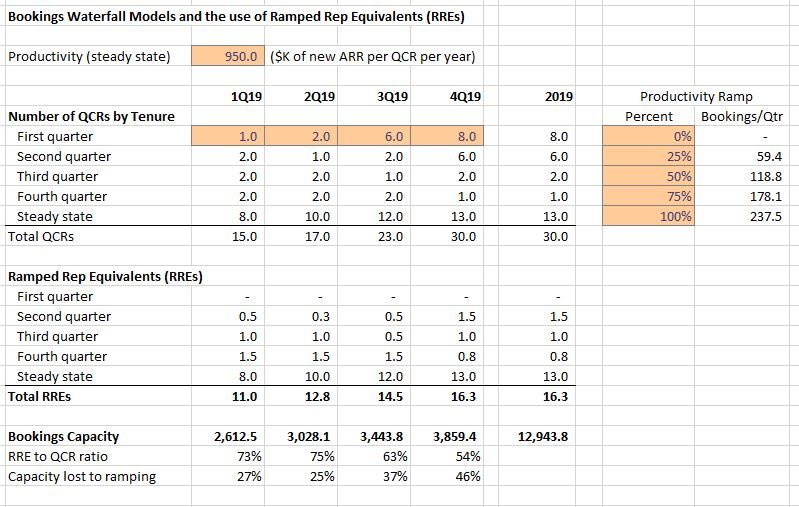
Rather than thinking about the partial productivity of whole reps, we can think about partial reps against whole productivity -- and build the model that way, instead. This has the by-product of creating a very useful number, the RRE. Then, to get bookings capacity just multiply the number of RREs times the steady-state productivity. Let's see an example below:
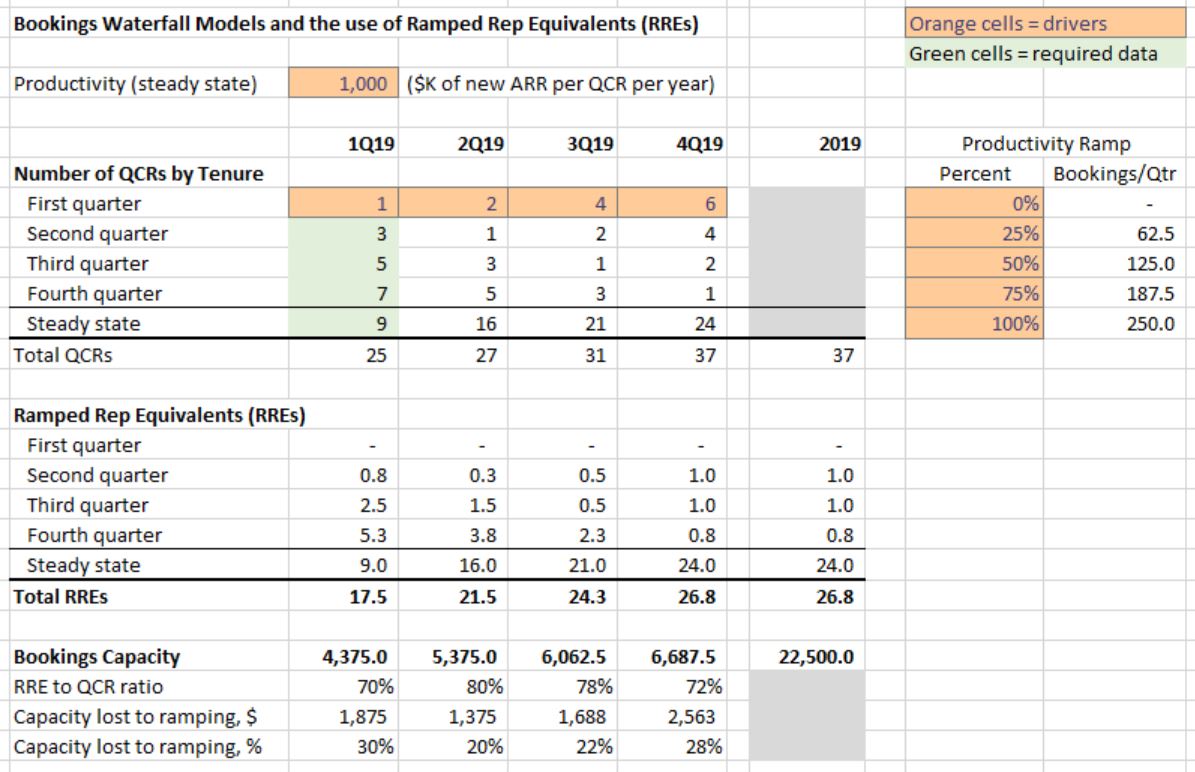
This provides a far more intuitive way of thinking about salesrep ramping. In 1Q19, the company has 25 reps, only 9 of whom are fully ramped, and rest combine to give the productivity of 8.5 additional reps, resulting in an RRE total of 17.5.
"We have 25 reps on board, but thanks to ramping, we only have the capacity equivalent to 17.5 fully-ramped reps at this time."
This also spits out three interesting metrics:
- RRE/QCR ratio: an effective vs. nominal capacity ratio -- in 1Q19, nominally we have 25 reps, but we have only the effective capacity of 17.5 reps. 17.5/25 = 70%.
- Capacity lost to ramping (dollars): to make the prior figure more visceral, think of the sales capacity lost due to ramping (i.e., the delta between your nominal and effective capacity) expressed in dollars. In this case, in 1Q19 we're losing $1,875K of our bookings capacity due to ramping.
- Capacity lost to ramping (percent): the same concept as the prior metric, simply expressed in percentage terms. In this case, in 1Q19 we're losing 30% of our bookings capacity due to ramping.
Impacts and CautionsIf you want to move to an RRE mindset, here are a few tips:
- RREs are useful for analytics, like sales productivity. When looking at actuals you can measure sales productivity not just by starting-period or average-period reps, but by RRE. It will provide a much more meaningful metric.
- You can use RREs to measure sales effectiveness. At the start of each quarter recalculate your theoretical capacity based on your actual staffing. Then divide your actuals by that start-of-quarter theoretical capacity and you will get a measure of how well you are performing, i.e., the utilization of the quarterly starting capacity in your sales force. When you're missing sales targets it is typically for one of two reasons: you don't have enough capacity or you're not making use of the capacity you have. This helps you determine which.
- Beware that if you have multiple types of reps (e.g., corporate and field), you be tempted to blend them in the same way you do whole reps today --i.e., when asked "how many reps do you have?" most people say "15" and not "9 enterprise plus 6 corporate." You have the same problem with RREs. While it's OK to present a blended RRE figure, just remember that it's blended and if you want to calculate capacity from it, you should calculate RREs by rep type and then get capacity by multiplying the RRE for each rep type by their respective steady-state productivity.
I recommend moving to an RRE mindset for modeling and analyzing sales capacity. If you want to play with the spreadsheet I made for this post, you can find it here.
Thanks to my friend Paul Albright for being the first person to introduce me to this idea.
# # #
Notes[1] This is actually a productivity model, based on actual sales productivity -- how much people have historically sold (and ergo should require little/no cushion before sales signs up for it). Most people I know work with a productivity model and then uplift the desired productivity by 15 to 25% to set quotas.
[2] Most companies have two or three types (e.g., corporate vs. field), so you typically need to build a waterfall for each type of rep.
[3] To build this model, you also need to know the aging of your existing salesreps -- i.e., how many second-, third-, fourth-, and steady-state-quarter reps you have at the start of the year.
[4] The glaring omission from this model is sales turnover. In order to keep it simple, it's not factored in here. While some people try to factor in sales turnover by using reduced sales productivity figures, I greatly prefer to model realistic sales productivity and explicitly model sales turnover in creating a sales bookings capacity model.
[5] This is one reason it's so expensive to build an enterprise software sales force. For several quarters you often get 100% of the cost and 50% of the sales capacity.
[6] Which should be an weighted average productivity by type of rep weighted by number of reps of each type.