How to Make and Use a Proper Sales Bookings Productivity and Quota Capacity Model
I’ve seen numerous startups try numerous ways to calculate their sales capacity. Most are too back-of-the-envelope and too top-down for my taste. Such models are, in my humble opinion, dangerous because the combination of relatively small errors in ramping, sales productivity, and sales turnover (with associated ramp resets) can result in a relatively big mistake in setting an operating plan. Building off quota, instead of productivity, is another mistake for many reasons [1].
Thus, to me, everything needs to begin with a sales productivity model that is Einsteinian in the sense that it is as simple as possible but no simpler.
What does such a model need to take into account?
- Sales productivity, measured in ARR/rep, and at steady state (i.e., after a rep is fully ramped). This is not quota (what you ask them to sell), this is productivity (what you actually expect them to sell) and it should be based on historical reality, with perhaps incremental, well justified, annual improvement.
- Rep hiring plans, measured by new hires per quarter, which should be realistic in terms of your ability to recruit and close new reps.
- Rep ramping, typically a vector that has percentage of steady-state productivity in the rep’s first, second, third, and fourth quarters [2]. This should be based in historical data as well.
- Rep turnover, the annual rate at which sales reps leave the company for either voluntary or involuntary reasons.
- Judgment, the model should have the built-in ability to let the CEO and/or sales VP manually adjust the output and provide analytical support for so doing [3].
- Quota over-assignment, the extent to which you assign more quota at the “street” level (i.e., sum of the reps) beyond the operating plan targets
- For extra credit and to help maintain organizational alignment -- while you’re making a bookings model, with a little bit of extra math you can set pipeline goals for the company’s core pipeline generation sources [4], so I recommend doing so.
If your company is large or complex you will probably need to create an overall bookings model that aggregates models for the various pieces of your business. For example, inside sales reps tend to have lower quotas and faster ramps than their external counterparts, so you’d want to make one model for inside sales, another for field sales, and then sum them together for the company model.
In this post, I’ll do two things: I’ll walk you through what I view as a simple-yet-comprehensive productivity model and then I’ll show you two important and arguably clever ways in which to use it.
Walking Through the Model
Let’s take a quick walk through the model. Cells in Excel “input” format (orange and blue) are either data or drivers that need to be entered; uncolored cells are either working calculations or outputs of the model.
You need to enter data into the model for 1Q20 (let’s pretend we’re making the model in December 2019) by entering what we expect to start the year with in terms of sales reps by tenure (column D). The “first/hired quarter” row represents our hiring plans for the year. The rest of this block is a waterfall that ages the rep downward as we move across quarters. Next to the block ramp assumption, which expresses, as a percentage of steady-state productivity, how much we expect a rep to sell as their tenure increases with the company. I’ve modeled a pretty slow ramp that takes five quarters to get to 100% productivity.
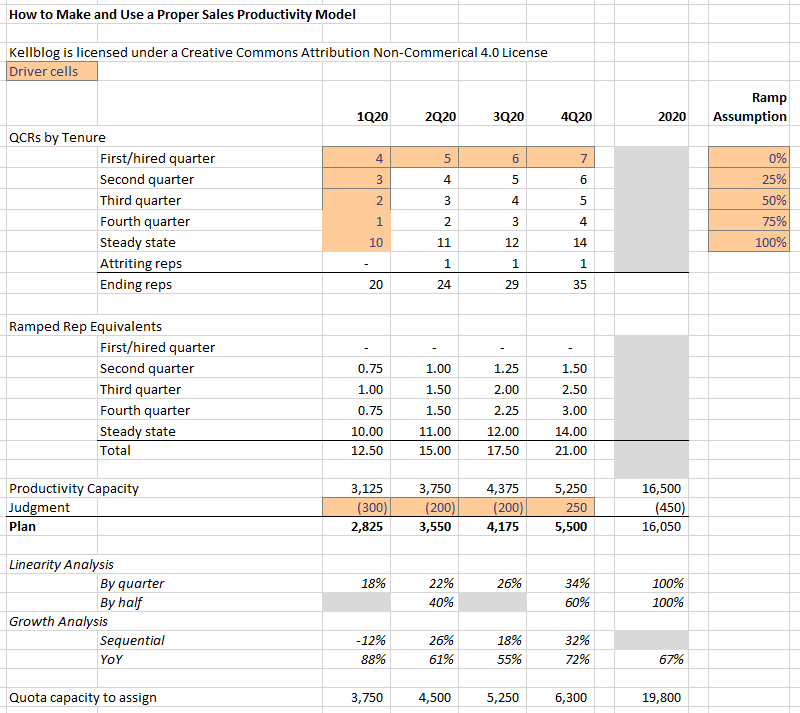
To the right of that we have more assumptions:
- Annual turnover, the annual rate at which sales reps leave the company for any reason. This drives attriting reps in row 12 which silently assumes that every departing rep was at steady state, a tacit fairly conservative assumption in the model.
- Steady-state productivity, how much we expect a rep to actually sell per year once they are fully ramped.
- Quota over-assignment. I believe it’s best to start with a productivity model and uplift it to generate quotas [5].
The next block down calculates ramped rep equivalents (RREs), a very handy concept that far too few organizations use to convert the ramp-state to a single number equivalent to the number of fully ramped reps. The steady-state row shows the number of fully ramped reps, a row that board members and investors will frequently ask about, particularly if you’re not proactively showing them RREs.
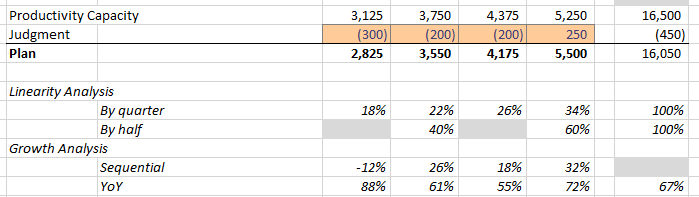
After that we calculate "productivity capacity," which is a mouthful, but I want to disambiguate it from quota capacity, so it’s worth the extra syllables. After that, I add a critical row called judgment, which allows the Sales VP or CEO to play with the model so that they’re not potentially signing up for targets that are straight model output, but instead also informed by their knowledge of the state of the deals and the pipeline. Judgment can be negative (reducing targets), positive (increasing targets) or zero-sum where you have the same annual target but allocate it differently across quarters.
The section in italics, linearity and growth analysis, is there to help the Sales VP analyze the results of using the judgment row. After changing targets, he/she can quickly see how the target is spread out across quarters and halves, and how any modifications affect both sequential and quarterly growth rates. I have spent many hours tweaking an operating plan using this part of the sheet, before presenting it to the board.
The next row shows quota capacity, which uplifts productivity capacity by the over-assignment percentage assumption higher up in the model. This represents the minimum quota the Sales VP should assign at street level to have the assumed level of over-assignment. Ideally this figure dovetails into a quota-assignment model.
Finally, while we’re at it, we’re only a few clicks away from generating the day-one pipeline coverage / contribution goals from our major pipeline sources: marketing, alliances, and outbound SDRs. In this model, I start by assuming that sales or customer success managers (CSMs) generate the pipeline for upsell (i.e., sales to existing customers). Therefore, when we’re looking at coverage, we really mean to say coverage of the newbiz ARR target (i.e., new ARR from new customers). So, we first reduce the ARR goal by a percentage and then multiple it by the desired pipeline coverage ratio and then allocate the result across the pipeline-sources by presumably agreed-to percentages [6].
Building the next-level models to support pipeline generation goals is beyond the scope of this post, but I have a few relevant posts on the subject including this three-part series, here, here, and here.
Two Clever Ways to Use the Model
The sad reality is that this kind of model gets a lot attention at the end of a fiscal year (while you’re making the plan for next year) and then typically gets thrown in the closet and ignored until it’s planning season again.
That’s too bad because this model can be used both as an evaluation tool and a predictive tool throughout the year.
Let’s show that via an all-too-common example. Let’s say we start 2020 with a new VP of Sales we just hired in November 2019 with hiring and performance targets in our original model (above) but with judgment set to zero so plan is equal to the capacity model.
Our “world-class” VP immediately proceeds to drive out a large number of salespeople. While he hires 3 "all-star" reps during 1Q20, all 5 reps hired by his predecessor in the past 6 months leave the company along with, worse yet, two fully ramped reps. Thus, instead of ending the quarter with 20 reps, we end with 12. Worse yet, the VP delivers new ARR of $2,000K vs. a target of $3,125K, 64% of plan. Realizing she has a disaster on her hands, the CEO “fails fast” and fires the newly hired VP of sales after 5 months. She then appoints the RVP of Central, Joe, to acting VP of Sales on 4/2. Joe proceeds to deliver 59%, 67%, and 75% of plan in 2Q20, 3Q20, and 4Q20.
Our question: is Joe doing a good job?
At first blush, he appears more zero than hero: 59%, 67%, and 75% of plan is no way to go through life.
But to really answer this question we cannot reasonably evaluate Joe relative to the original operating plan. He was handed a demoralized organization that was about 60% of its target size on 4/2. In order to evaluate Joe’s performance, we need to compare it not to the original operating plan, but to the capacity model re-run with the actual rep hiring and aging at the start of each quarter.
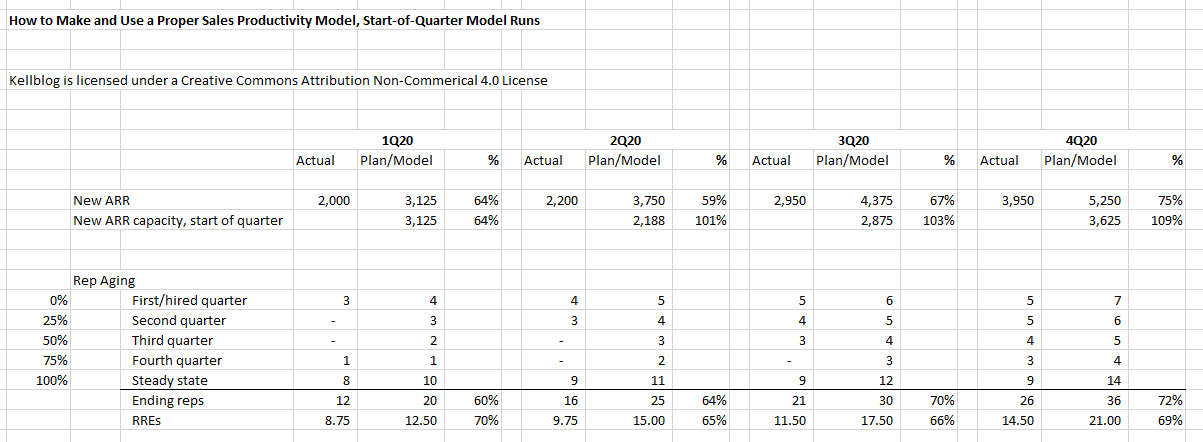
When you do this you see, for example, that while Joe is constantly underperforming plan, he is also constantly outperforming the capacity model, delivering 101%, 103%, and 109% of model capacity in 2Q through 4Q.
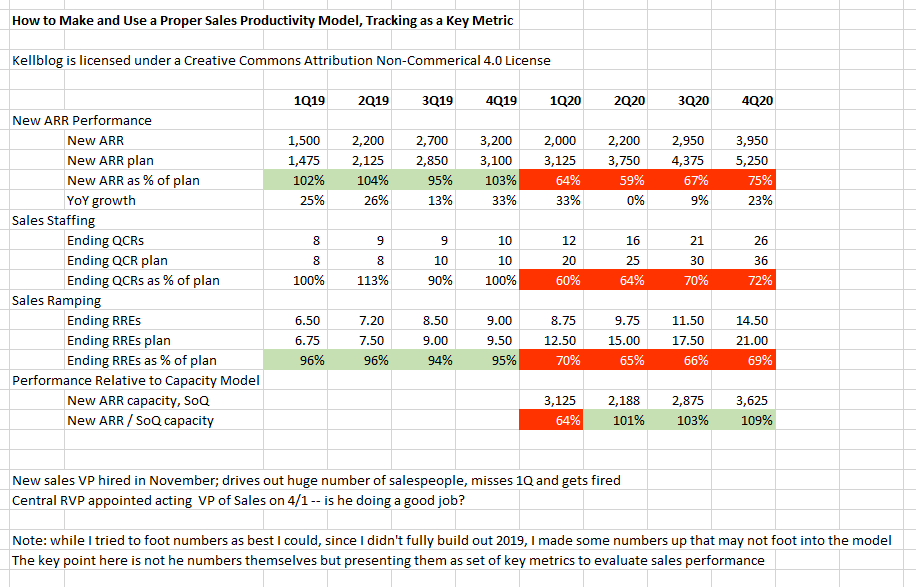
If you looked at Joe the way most companies look at key metrics, he’d be fired. But if you read this chart to the bottom you finally get the complete picture. Joe is running a significantly smaller sales organization at above-model efficiency. While Joe got handed an organization that was 8 heads under plan, he did more than double the organization to 26 heads and consistently outperformed the capacity model. Joe is a hero, not a zero. But you’d never know if you didn’t look at his performance relative to the actual sales capacity he was managing.
Second, I'll say the other clever way to use a capacity model is as a forecasting tool. I have found a good capacity model, re-run at the start of the quarter with then-current sales hiring/aging is a very valuable predictive tool, often predicting the quarterly sales result better than my VP of Sales. Along with rep-level, manager-level, and VP-level forecasts and stage-weighted and forecast-category-weighted expected pipeline values, you can use the re-run sales capacity model as a great tool to triangulate on the sales forecast.
You can download the four-tab spreadsheet model I built for this post, here.
# # #
Notes
[1] Starting with quota starts you in the wrong mental place -- what you want people to do, as opposed to productivity (what they have historically done). Additionally, there are clear instances where quotas get assigned against which we have little to no actual productivity assumption (e.g., a second-quarter rep typically has zero productivity but will nevertheless be assigned some partial quota). Sales most certainly has a quota-allocation problem, but that should be a separate, second exercise after building a corporate sales productivity model on which to base the operating plan.
[2] A typically such vector might be (0%, 25%, 50%, 100%) or (0%, 33%, 66%, 100%) reflecting the percentage of steady-state productivity they are expected to achieve in their first, second, third, and fourth quarters of employment.
[3] Without such a row, the plan is either de-linked from the model or the plan is the pure output of the model without any human judgement attached. This row is typically used to re-balance the annual number across quarters and/or to either add or subtract cushion relative to the model.
[4] Back in the day at Salesforce, we called pipeline generation sources "horsemen" I think (in a rather bad joke) because there were four of them (marketing, alliances, sales, and SDRs/outbound). That term was later dropped probably both because of the apocalypse reference and its non gender-neutrality. However, I've never known what to call them since, other than the rather sterile, "pipeline sources."
[5] Many salesops people do it the reverse way -- I think because they see the problem as allocating quota whereas I see the the problem as building an achievable operating plan. Starting with quota poses several problems, from the semantic (lopping 20% off quota is not 20% over-assignment, it’s actually 25% because over-assignment is relative to the smaller number) to the mathematical (first-quarter reps get assigned quota but we can realistically expect a 0% yield) to the procedural (quotas should be custom-tailored based on known state of the territory and this cannot really be built into a productivity model).
[6] One advantages of having those percentages here is they are placed front-and-center in the company's bookings model which will force discussion and agreement. Otherwise, if not documented centrally, they will end up in different models across the organization with no real idea of whether they either foot to the bookings model or even sum to 100% across sources.