Demystifying the Growth-Adjusted Enterprise Value to Revenue Multiple, and Introducing the ERG Ratio.
The growth-adjusted enterprise value to revenue multiple is a personal favorite metric because it’s a quick way to determine if a SaaS stock is in the bargain basement, where I sometimes like to shop. Quick reminders before proceeding:
- I don’t give investment advice, see my terms & conditions and FAQ
- Any bargain basement shopper needs to heed Wall Street’s warnings about catching falling knives. (Something I’ve painfully done many times in my dabbling as an investor.)
But, attention Kmart shoppers, if you’re looking for the blue light specials, this metric may help you find them.
Let’s be clear. While most of my attention is on operator metrics, this is an investor metric. But other SaaS experts also track it. Jamin Ball at Altimeter, author of Clouded Judgement, posts about growth-adjusted software multiples from time to time. Meritech includes growth-adjusted EV to revenue in public comps benchmarking site.
I like this metric because it reminds me of one of the first metrics I ever used to evaluate stocks: the price/earnings to growth ratio, also known as the PEG ratio, popularized by Peter Lynch in his 1990's book One Up on Wall Street.
The PEG ratio compares a stock’s price/earnings (P/E) ratio to its earnings growth rate. For example, if a stock trades at a P/E of 15x and its earnings growth is 15% a year [1], then its PEG ratio is 15/15 = 1. As it turns out, a PEG of 1.0 tends to be the norm. A PEG > 1.0 suggests a stock is over-valued (relative to its earning growth). And a PEG < 1.0 suggests a stock is under-valued. So, if you’re measuring the value of a stock by its P/E ratio and you’re looking for the bargain basement, you can screen for stocks with a PEG well below 1.0.
Note that -- and this is foreshadowing -- instead of calling it the PEG ratio, they could have called it the growth-adjusted P/E ratio. It’s the same thing; the latter just has 8 times as many syllables as the former.
Today, software investors don’t really value stocks based on price/earning multiples. Far more commonly, you’ll hear about enterprise-value/revenue (EV/R) multiples instead [2]. So how do we map this growth-adjusted concept to EV/R? It’s easy, do the same math, and just divide EV/R by growth:
Growth-adjusted EV/R ratio = enterprise-value/revenue/growth.
There are three potential complexities with this metric:
1. The name. Coming in at a whopping 13 syllables, the name is a prohibitive mouthful [3]. If we borrow the naming convention from the PEG ratio, we can just call this the ERG ratio -- Enterprise value to Revenue to Growth. At a single syllable, ERG gets us an A+ in syllabic parsimony.
2. The details of the definition. EV is almost always a current snapshot, but you can use either forward or trailing revenue and revenue growth rates. This introduces potential confusion, so the most important part is ensuring you know what you’re looking at before making comparisons. Beyond that, we just need to pick a convention, and I’ll be happy to steal Meritech’s --
Growth Adjusted EV (Enterprise Value) / NTM (next-twelve-months) Revenue is calculated by dividing enterprise value over NTM revenue over LTM (last-twelve-months) revenue growth rate.
3. It’s non-intuitive. I embraced this metric somewhat reluctantly because, unlike PEG, I have no intuitive sense of what the value should be. Somehow, the center of PEG at 1.0 is both intuitive and convenient. For the ERG ratio, today’s median is about 0.3 which does little for me intuitively.
Let's look at some numbers to try and build some intuitive sense around this metric.
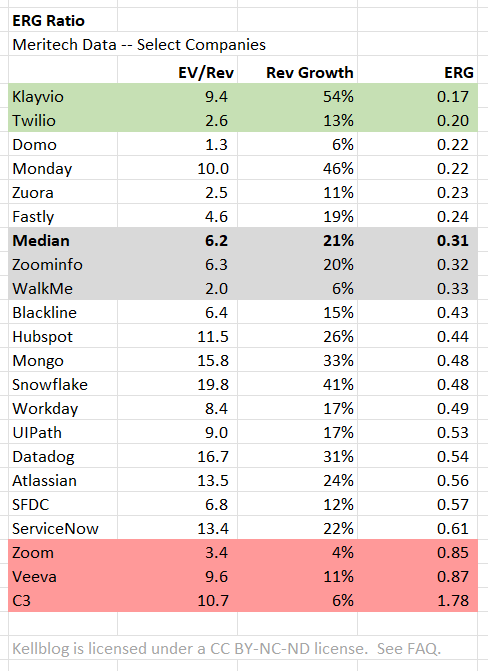
Above is a set of companies I arbitrarily picked from Meritech's public comps. The median [4] EV/R for all of the Meritech data is 6.2, median revenue growth is 21%, and median ERG is 0.31.
One rule of thumb I get from the above is that your EV/R mutiple should be around 1/3rd of your growth rate. To the extent the ERG ratio is much lower than one-third, it suggests a stock is cheap for its growth. To the extent the ERG is much higher than one-third, it suggests a stock is expensive for its growth. For example:
- While Klayvio is trading at a lofty 9.4x revenues, it is growing at a rapid 54%. Hence an ERG of 0.17, making the stock appear cheap relative to its growth [5].
- While C3 is trading at a even loftier 10.7x revenues, it is growing at only 6%. Hence, an ERG of 1.78, making its stock appear expensive relative to its growth.
- In fact, Domo is also growing at 6%, yet trading at a low 1.3x revenues, about 1/8th as much as C3 [6].
- Zoominfo and Walkme are both at the median, though they get there in very different ways. Zoominfo trades at 6.3x revenues and is growing at 20%. WalkMe is trading at only 2.0x revenues but also growing only 6%.
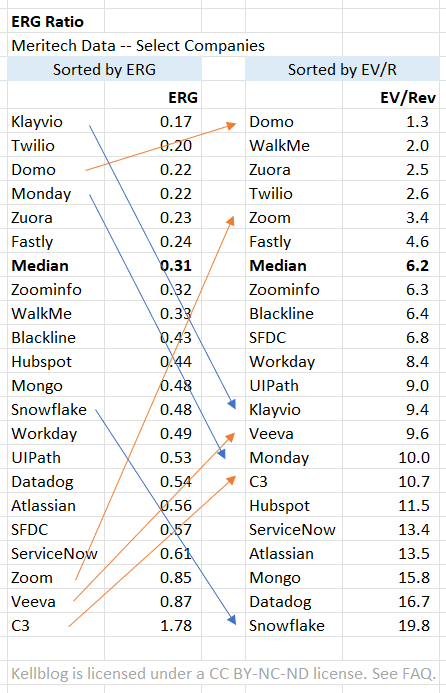
Perhaps the most interesting exercise is to sort this list by ERG and then sort it by EV/R -- the more traditional way of determining whether a stock is cheap or expensive.

I've shown some of the bigger movers using blue arrows when they move down the list and orange when they move up. For example, Wall Street likes Snowflake relative to its growth with an ERG of 0.48, but Wall Street loves Snowflake when looking only a EV/R multiple. Put differently, Snowflake looks a lot overvalued when comparing its EV/R multiple to the median; it looks a lot less overvalued when also considering its zippy growth rate.
I hope this post has demystified this useful metric somewhat, and planted the seed that if this metric is ever going to be popular, it can't have a 13-syllable name. If you'd like to hear my metrics brother, Ray Rike, and I discussing this ratio, you can listen to the SaaS Talk podcast episode on ERG.
# # #
Notes
[1] Technically, it’s the growth rate times 100 to convert the percent to a number.
[2] Back in the day, we’d talk about the price/sales ratio, the price of share divided by the sales per share. If you take that ratio and multiply the numerator and denominator by the number of shares, you get market-capitalization/revenue, which is one adjustment away from enterprise-value/revenue. In effect, making the EV/R multiple the rough equivalent, and simply a modernized version, of a P/S ratio.
[3] Los Angeles comes in at four syllables and people still abbreviate it to LA to save two.
[4] Nit, but the median EV/R divided by the median growth rate will not necessarily (or even usually) produce the median ERG. Hence the small difference between 0.295 (by dividing the medians) and the actual median value of 0.31.
[5] Which then begs the obvious question, why? For Klayvio, I don't know the answer.
[6] This again begs the question, why? For C3, I'm guessing it's probably because of their strong positioning around AI which is red hot right now.