Category Archives: IPO

It Ain’t Easy Making Money in Open Source:  Thoughts on the Hortonworks S-1

It took me a week or so to get to it, but in this post I’ll take a dive into the Hortonworks S-1 filing in support of a proposed initial public offering (IPO) of their stock.

While Hadoop and big data are unarguably huge trends driving the industry and while the future of Hadoop looks very bright indeed, on reading the Hortonworks S-1, the reader is drawn to the inexorable conclusion that  it’s hard to make money in open source, or more crassly, it’s hard to make money when you give the shit away.

This is a company that,  in the past three quarters, lost $54M on $33M of support/services revenue and threw in $26M in non-recoverable (i.e., donated) R&D atop that for good measure.

Let’s take it top to bottom:

  • They have solid bankers: Goldman Sachs, Credit Suisse, and RBC are leading the underwriting with specialist support from Pacific Crest, Wells Fargo, and Blackstone.
  • They have an awkward, jargon-y, and arguably imprecise marketing slogan: “Enabling the Data-First Enterprise.”  I hate to be negative, but if you’re going to lose $10M a month, the least you can do is to invest in a proper agency to make a good slogan.
  • Their mission is clear: “to establish Hadoop as the foundational technology of the modern enterprise data architecture.”
  • Here’s their solution description: “our solution is an enterprise-grade data management platform built on a unique distribution of Apache Hadoop and powered by YARN, the next generation computing and resource management framework.”
  • They were founded in 2011, making them the youngest company I’ve seen file in quite some years. Back in the day (e.g., the 1990s) you might go public at age 3-5, but these days it’s more like age 10.
  • Their strategic partners include Hewlett-Packard, Microsoft, Rackspace, Red Hat, SAP, Teradata, and Yahoo.
  • Business model:  “consistent with our open source approach, we generally make the Hortonworks Data Platform available free of charge and derive the predominant amount of our revenue from customer fees from support subscription offerings and professional services.”  (Note to self:  if you’re going to do this, perhaps you shouldn’t have -35% services margins, but we’ll get to that later.)
  • Huge market opportunity: “According to Allied Market Research, the global Hadoop market spanning hardware, software and services is expected to grow from $2.0 billion in 2013 to $50.2 billion by 2020, representing a compound annual growth rate, or CAGR, of 58%.”  This vastness of the market opportunity is unquestioned.
  • Open source purists: “We are committed to serving the Apache Software Foundation open source ecosystem and to sharing all of our product developments with the open source community.”  This one’s big because while it’s certainly strategic and it certainly earns them points within the Hadoop community, it chucks out one of the better ways to make money in open source:  proprietary versions / extensions.  So, right or wrong, it’s big.
  • Headcount:  The company has increased the number of full-time employees from 171 at December 31, 2012 to 524 at September 30, 2014

Before diving into the financials, let me give readers a chance to review open source business models (Wikipedia, Kellblog) if they so desire, before making the (generally true but probably slightly inaccurate) assertion:  the only open source company that’s ever made money (at scale) is Red Hat.

Sure, there have been a few great exits.  Who can forget MySQL selling to Sun for $1B?  Or VMware buying SpringSource for $420M?  Or RedHat buying JBoss for $350M+?  (Hortonworks CEO Rob Bearden was involved in both of the two latter deals.)   Or Citrix buying XenSource for $500M?

But after those deals, I can’t name too many others.  And I doubt any of those companies was making money.

In my mind there are a two common things that go wrong in open source:

  • The market is too small. In my estimation open source compresses the market size by 10-20x.  So if you want to compress the $30B DBMS market 10x, you can still build several nice companies.  However, if you want to compress the $1B enterprise search market by 10x, there’s not much room to build anything.  That’s why there is no Red Hat of Lucene or Solr, despite their enormous popularity in search.    For open source to work, you need to be in a huge market.
  • People don’t renew. No matter which specific open source business model you’re using, the general play is to sell a subscription to <something> that complements your offering.  It might be a hardened/certified version of the open source product.  It might be additions to it that you keep proprietary forever or, in a hardcover/paperback analogy, roll back into the core open source projects with a 24 month lag.  It might be simply technical support.  Or, it might be “admission the club” as one open source CEO friend of mine used to say:  you get to use our extensions, our support, our community, etc.  But no matter what you’re selling, the key is to get renewals.  The risk is that the value of your extensions decreases over time and/or customers become self-sufficient.    This was another problem with Lucene.  It was so good that folks just didn’t need much help and if they did, it was only for a year or so.

So Why Does Red Hat work?

Red Hat uses a professional open source business model  applied to primarily two low-level infrastructure categories:  operating systems and later middleware.   As general rules:

  • The lower-level the category the more customers want support on it.
  • The more you can commoditize the layers below you, the more the market likes it. Red Hat does this for servers.
  • The lower-level the category the more the market actually “wants” it standardized in order to minimize entropy. This is why low-level infrastructure categories become natural monopolies or oligopolies.

And Red Hat set the right price point and cost structure.  In their most recent 10-Q, you can see they have 85% gross margins and about a 10% return on sales.  Red Hat nailed it.

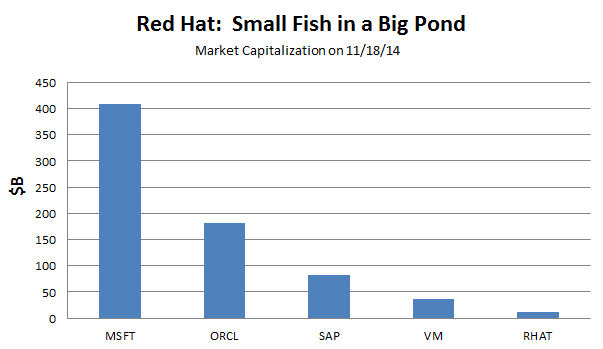
But, if you believe this excellent post by Andreessen Horowitz partner Peter Levine, There Will Never Be Another Red Hat.  As part of his argument Levine reminds us that while Red Hat may be a giant among open source vendors, that among general technology vendors they are relatively small.  See the chart below for the market capitalization compared to some megavendors.

rhat small fish

Now this might give pause to the Hadoop crowd with so many firms vying to be the Red Hat of Hadoop.  But that hasn’t stopped the money from flying in.  Per Crunchbase, Cloudera has raised a stunning $1.2B in venture capital, Hortonworks has raised $248M, and MapR has raised $178M.  In the related Cassandra market, DataStax has raised $190M.  MongoDB (with its own open source DBMS) has raised $231M.  That’s about $2B invested in next-generation open source database venture capital.

While I’m all for open source, disruption, and next-generation databases (recall I ran MarkLogic for six years), I do find the raw amount of capital invested pretty crazy.   Yes, it’s a huge market today.  Yes, it’s exploding as do data volumes and the new incorporation of unstructured data.  But we will be compressing it 10-20x as part of open-source-ization.  And, given all the capital these guys are raising – and presumably burning (after all, why else would you raise it), I can assure you that no one’s making money.

Hortonworks certainly isn’t — which serves as a good segue to dive into the financials.  Here’s the P&L, which I’ve cleaned up from the S-1 and color-annotated.

horton pl

  •  $33M in trailing three quarter (T3Q) revenues ($41.5M in TTM, though not on this chart)
  • 109% growth in T3Q revenues
  • 85% gross margins on support
  • Horrific -35% gross margins on services which given the large relative size of the services business (43% of revenues) crush overall gross margins down to 34%
  • More scarily this calls into question the veracity of the 85% subscription gross margins — I recall reading in the S-1 that they current lack VSOE for subscription support which means that they’ve not yet clearly demonstrated what is really support revenue vs. professional services revenue.  [See footnote 1]
  • $26M in T3Q R&D expense.  Per their policy all that value is going straight back to the open source project which begs the question will they ever see return on it?
  • Net loss of $86.7M in T3Q, or nearly $10M per month

Here are some other interesting tidbits from the S-1:

  • Of the 524 full-time employee as of 9/30/14, there are 56 who are non-USA-based
  • CEO makes $250K/year in base salary cash compensation with no bonus in FY13 (maybe they missed plan despite strong growth?)
  • Prior to the offering CEO owns 6.8% of the stock, a pretty nice percentage, but he was a kind-of a founder
  • Benchmark owns 18.7%
  • Yahoo owns 19.6%
  • Index owns 9.5%
  • $54.9M cash burn from operations in T3Q, $6.1M per month
  • Number of support subscription customers has grown from 54 to 233 over the year from 9/30/13 to 9/30/14
  • A single customer represented went from 47% of revenues for the T3Q ending 9/30/13 down to 22% for the T3Q ending 9/30/14.  That’s a lot of revenue concentration in one customer (who is identified as “Customer A,” but who I believe is Microsoft based on some text in the risk factors.)

Here’s a chart I made of the increase in value in the preferred stock.  A ten-bagger in 3 years.

horton pref

One interesting thing about the prospectus is they show “gross billings,” which is an interesting derived metric that financial analysts use to try and determine bookings in a subscription company.  Here’s what they present:

horton billings

While gross billings is not a bad stab at bookings, the two metrics can diverge — primarily when the duration of prepaid contracts changes.  Deferred revenue can shoot up when sales sells longer prepaid contracts to a given number of customers as opposed to the same-length contract to more of them.  Conversely, if happy customers reduce prepaid contract duration to save cash in a downturn, it can actually help the vendor’s financial performance (they will get the renewals because the customer is happy and not discount in return for multi-year), but deferred revenue will drop as will gross billings.  In some ways, unless prepaid contract duration is held equal, gross billings is more of a dangerous metric than anything else.  Nevertheless Hortonworks is showing it as an implied metric of bookings or orders and the growth is quite impressive.

Sales and Marketing Efficiency

Let’s now look at sales and marketing efficiency, not using the CAC which is too hard to calculate for public companies but using JMP’s sales and marketing efficiency metric = gross profit [current] – gross profit [prior] / S&M expense [prior].

On this metric Hortonworks scores a 41% for the T3Q ended 9/30/14 compared to the same period in 2013.  JMP considers anything above 50% efficient, so they are coming in low on this metric.  However, JMP also makes a nice chart that correlates S&M efficiency to growth and I’ve roughly hacked Hortonworks onto it here:

JMP

I’ll conclude the main body of the post by looking at their dollar-based expansion rate.  Here’s a long quote from the S-1:

Dollar-Based Net Expansion Rate.    We believe that our ability to retain our customers and expand their support subscription revenue over time will be an indicator of the stability of our revenue base and the long-term value of our customer relationships. Maintaining customer relationships allows us to sustain and increase revenue to the extent customers maintain or increase the number of nodes, data under management and/or the scope of the support subscription agreements. To date, only a small percentage of our customer agreements has reached the end of their original terms and, as a result, we have not observed a large enough sample of renewals to derive meaningful conclusions. Based on our limited experience, we observed a dollar-based net expansion rate of 125% as of September 30, 2014. We calculate dollar-based net expansion rate as of a given date as the aggregate annualized subscription contract value as of that date from those customers that were also customers as of the date 12 months prior, divided by the aggregate annualized subscription contract value from all customers as of the date 12 months prior. We calculate annualized support subscription contract value for each support subscription customer as the total subscription contract value as of the reporting date divided by the number of years for which the support subscription customer is under contract as of such date.

This is probably the most critical section of the prospectus.  We know Hortonworks can grow.  We know they have a huge market.  We know that market is huge enough to be compressed 10-20x and still have room to create a a great company.  What we don’t know is:  will people renew?   As we discussed above, we know it’s one of the great risks of open source

Hortonworks pretty clearly answers the question with “we don’t know” in the above quote.  There is simply not enough data, not enough contracts have come up for renewal to get a meaningful renewal rate.  I view the early 125% calculation as a very good sign.  And intuition suggests that — if their offering is quality — that people will renew because we are talking low-level, critical infrastructure and we know that enterprises are willing to pay to have that supported.

# # #

Appendix

In the appendix below, I’ll include a few interesting sections of the S-1 without any editorial comments.

A significant portion of our revenue has been concentrated among a relatively small number of large customers. For example, Microsoft Corporation historically accounted for 55.3% of our total revenue for the year ended April 30, 2013, 37.8% of our total revenue for the eight months ended December 31, 2013 and 22.4% of our total revenue for the nine months ended September 30, 2014. The revenue from our three largest customers as a group accounted for 71.0% of our total revenue for the year ended April 30, 2013, 50.5% of our total revenue for the eight months ended December 31, 2013 and 37.4% of our total revenue for the nine months ended September 30, 2014. While we expect that the revenue from our largest customers will decrease over time as a percentage of our total revenue as we generate more revenue from other customers, we expect that revenue from a relatively small group of customers will continue to account for a significant portion of our revenue, at least in the near term. Our customer agreements generally do not contain long-term commitments from our customers, and our customers may be able to terminate their agreements with us prior to expiration of the term. For example, the current term of our agreement with Microsoft expires in July 2015, and automatically renews thereafter for two successive twelve-month periods unless terminated earlier. The agreement may be terminated by Microsoft prior to the end of its term. Accordingly, the agreement with Microsoft may not continue for any specific period of time.

# # #

We do not currently have vendor-specific objective evidence of fair value for support subscription offerings, and we may offer certain contractual provisions to our customers that result in delayed recognition of revenue under GAAP, which could cause our results of operations to fluctuate significantly from period-to-period in ways that do not correlate with our underlying business performance.

In the course of our selling efforts, we typically enter into sales arrangements pursuant to which we provide support subscription offerings and professional services. We refer to each individual product or service as an “element” of the overall sales arrangement. These arrangements typically require us to deliver particular elements in a future period. We apply software revenue recognition rules under U.S. generally accepted accounting principles, or GAAP. In certain cases, when we enter into more than one contract with a single customer, the group of contracts may be so closely related that they are viewed under GAAP as one multiple-element arrangement for purposes of determining the appropriate amount and timing of revenue recognition. As we discuss further in “Management’s Discussion and Analysis of Financial Condition and Results of Operations—Critical Accounting Policies and Estimates—Revenue Recognition,” because we do not have VSOE for our support subscription offerings, and because we may offer certain contractual provisions to our customers, such as delivery of support subscription offerings and professional services, or specified functionality, or because multiple contracts signed in different periods may be viewed as giving rise to multiple elements of a single arrangement, we may be required under GAAP to defer revenue to future periods. Typically, for arrangements providing for support subscription offerings and professional services, we have recognized as revenue the entire arrangement fee ratably over the subscription period, although the appropriate timing of revenue recognition must be evaluated on an arrangement-by-arrangement basis and may differ from arrangement to arrangement. If we are unexpectedly required to defer revenue to future periods for a significant portion of our sales, our revenue for a particular period could fall below  our expectations or those of securities analysts and investors, resulting in a decline in our stock price

 # # #

We generate revenue by selling support subscription offerings and professional services. Our support subscription agreements are typically annual arrangements. We price our support subscription offerings based on the number of servers in a cluster, or nodes, data under management and/or the scope of support provided. Accordingly, our support subscription revenue varies depending on the scale of our customers’ deployments and the scope of the support agreement.

 Our early growth strategy has been aimed at acquiring customers for our support subscription offerings via a direct sales force and delivering consulting services. As we grow our business, our longer-term strategy will be to expand our partner network and leverage our partners to deliver a larger proportion of professional services to our customers on our behalf. The implementation of this strategy is expected to result in an increase in upfront costs in order to establish and further cultivate such strategic partnerships, but we expect that it will increase gross margins in the long term as the percentage of our revenue derived from professional services, which has a lower gross margin than our support subscriptions, decreases.

 # # #

Deferred Revenue and Backlog

Our deferred revenue, which consists of billed but unrecognized revenue, was $47.7 million as of September 30, 2014.

Our total backlog, which we define as including both cancellable and non-cancellable portions of our customer agreements that we have not yet billed, was $17.3 million as of September 30, 2014. The timing of our invoices to our customers is a negotiated term and thus varies among our support subscription agreements. For multiple-year agreements, it is common for us to invoice an initial amount at contract signing followed by subsequent annual invoices. At any point in the contract term, there can be amounts that we have not yet been contractually able to invoice. Until such time as these amounts are invoiced, we do not recognize them as revenue, deferred revenue or elsewhere in our consolidated financial statements. The change in backlog that results from changes in the average non-cancelable term of our support subscription arrangements may not be an indicator of the likelihood of renewal or expected future revenue, and therefore we do not utilize backlog as a key management metric internally and do not believe that it is a meaningful measurement of our future revenue.

 # # #

We employ a differentiated approach in that we are committed to serving the Apache Software Foundation open source ecosystem and to sharing all of our product developments with the open source community. We support the community for open source Hadoop, and employ a large number of core committers to the various Enterprise Grade Hadoop projects. We believe that keeping our business model free from architecture design conflicts that could limit the ultimate success of our customers in leveraging the benefits of Hadoop at scale is a significant competitive advantage.

 # # #

International Data Corporation, or IDC, estimates that data will grow exponentially in the next decade, from 2.8 zettabytes, or ZB, of data in 2012 to 40 ZBs by 2020. This increase in data volume is forcing enterprises to upgrade their data center architecture and better equip themselves both to store and to extract value from vast amounts of data. According to IDG Enterprise’s Big Data Survey, by late 2014, 31% of enterprises with annual revenues of $1 billion or more expect to manage more than one PB of data. In comparison, as of March 2014 the Library of Congress had collected only 525 TBs of web archive data, equal to approximately half a petabyte and two million times smaller than a zettabyte.

# # #

Footnotes:

[1]  Thinking more about this, while I’m not an accountant, I think the lack of VSOE has the following P&L impact:  it means that in contracts that mix professional services and support they must recognize all the revenue ratably over the contract.  That’s fine for the support revenue, but it should have the effect of pushing out services revenue, artificially depressing services gross margins.  Say, for example you did a $240K that was $120K of each.  The support should be recognized at $30K/quarter.  However, if the consulting is delivered in the first six months it should be delivered at $60K/quarter for the first and second quarters and $0 in the third and fourth.  Since, normally, accountants will take the services costs up-front this should have the effect of hurting services by taking the costs as delivered but by the revenue over a longer period.

[2] See here for generic disclaimers and please note that in the past I have served as an advisor to MongoDB

A Look at the Zendesk S-1 (IPO)

I thought I’d take a quick read of the Zendesk S-1 today, so here are my real-time notes on so doing.  Before diving in, let me provide a quick pointer to David Cummings’ summary of the same.

My notes:

  • 40,000 customers in 140 countries
  • 2012 revenues of $38.2M
  • 2013 revenues of $72.0M, 88% growth
  • 41% of revenues from international.  (High for a SaaS company at this size, but makes sense given their roots.)
  • Net loss of $24.4M and $22.6M in 2012 and 2013, -30% net loss in 2013
  • Zendesk approach:  beautifully simple, omni-channel, affordable, natively mobile, cloud-based, open, proactive, strategic.  They do this well.  (I’ve always viewed them as a very well run, low-end-up market entrant.)
  • Founded in Denmark in 2007.
  • 115M shares outstanding anticipated after the offering with seemingly another 40M in options under various options and ESOP plans.  (Seems like a lot of dilution looming.)
  • 65% gross margins.  (Though they don’t break out subscription vs. service which probably depresses things a tad.)
  • 20% of revenue spent on R&D.  (Normal.)
  • 52% of revenue on S&M.  (High, particularly for freemium which is notionally low-cost!)
  • 22% of revenue on G&A  (Normal to high, probably due to IPO itself.)
  • $53M in cash at 12/31/13
  • Headcount growth from 287 to 473 employees in year ended 12/31/13, up 68%
  • They have experienced security breaches:

“We have experienced significant breaches of our security measures and our customer service platform and live chat software are at risk for future breaches as a result of third-party action, employee, vendor, or contractor error, malfeasance, or other factors. For example, in February 2013, we experienced a security breach involving unauthorized access to three of our customers’ accounts and personal information of consumers maintained in those customer accounts.”

  • “[We are] highly dependent on free trials.”  (These guys define freemium model for enterprise software in my opinion.)
  • S&M org grew from 85 to 165 employees in period ending 12/31/13.
  • Owe $23.8M on a credit facility.  (Rare to see this much debt, but probably a smart way to reduce equity dilution.)
  • The three principles that drive the founders:  Have great products.  Care for your customers.  Attract a great team.  (Beats “Don’t Be Evil” any day in my book.)
  • Dollar-based “net expansion rate” (closest thing they discuss relative to renewals or churn):

    “We calculate our dollar-based net expansion rate by dividing our retained revenue net of contraction and churn by our base revenue. We define our base revenue as the aggregate monthly recurring revenue of our customer base as of the date one year prior to the date of calculation. We define our retained revenue net of contraction and churn as the aggregate monthly recurring revenue of the same customer base included in our measure of base revenue at the end of the annual period being measured. Our dollar-based net expansion rate is also adjusted to eliminate the effect of certain activities that we identify involving the transfer of agents between customer accounts, consolidation of customer accounts, or the split of a single customer account into multiple customer accounts. […] Our dollar-based net expansion rate was 126% and 123% as of December 31, 2012 and 2013, respectively. We expect our dollar-based net expansion rate to decline over time as our aggregate monthly recurring revenue grows.”

  • $66M accumulated deficit
  • Have data centers in North America, Europe, and Asia
  • 4Q13/4Q12 growth rate = 83% compared to 2013/2012 growth rate = 88%.  (Suggests growth is gently decelerating.)
  • Cashflow from operations in 2013 = $4.0M.
  • But they had -$24.1M in cashflow from investing activities.  (This is confusing because it’s a mix of items but broken into $12.4M in “marketable securities, property and equipment,” $7.1M to build data centers, and $4.7M in capitalized software development.  I’m not an accountant but if you ask me if “the business” is cashflow positive, the answer is no despite the $4.0M positive cashflow from operations. Building data centers and developing software, regardless of accounting classification, are all part of running the business to me.)
  • I am surprised they capitalize R&D.  Most software companies, far as I know, don’t.

zendesk common fmv


The FMV of the common stock is depicted above, by my math an annual 68% appreciation rate.

  • Huge number of leads are organic:  “the quarter ended December 31, 2013, 70% of our qualified sales leads, which are largely comprised of prospects that commence a free trial of our customer service platform, came from organic search, customer referrals, and other unpaid sources.”
  • SVPs listed (CFO, R&D) earn $240K base + $40K bonus
  • Automatic 5% share expansion / “overhang” built into the stock option and incentive plan.  Pretty rich in my experience and haven’t noticed anyone else doing it automatically before.
  • Letting execs buy stock with promissory notes … hum, I thought that went out with leg warmers.  Both loans were paid off by 12/31/31 and maybe that’s why.
  • CEO will own 7.1% of shares after the offering, including 4.3M (of the 8.1M beneficially owned) granted as options at the 2/14 board meeting.  (Seems odd to me; a huge option grant right before the IPO.  Hum.)
  • Nice banker line-up:  Goldman Sachs, Morgan Stanley, Credit Suisse, Pacific Crest
  • Raised $71M in preferred equity / venture capital
  • They do monthly, quarterly, and annual invoicing.  (Surprised they offer the short terms, particularly monthly.)
  • $6.5M in advertising expense in 2013
  • $11.4M in capitalized “internal use” software on the balance sheet at 12/31/13
  • They paid $16M for the Zopim (live chat) acquisition
  • Ticker symbol:  ZEN

First-Day Stock Price Appreciation is Not the Correct Measure of IPO Success

Zynga went public last Friday.  The company raised $100M and was valued at around $7B off TTM revenues of about $1B (see S-1 here).  This puts the Zynga’s valuation in the same range as Electronic Arts, a company founded in 1982 and whose TTM revenues are 3.6x times larger at $3.6B.  One might easily say:  “Wow!”

But because the shares did not rocket upwards on the first day of trading the media portrayed the IPO as lackluster.  Consider, for example, some of these headlines:

I’d argue that the Zynga IPO was a tremendous success.  Why?

  • The company is now public and has established a liquid market for its shares.  This, over time, will benefit existing shareholders who want liquidity and will facilitate future fundraising for the company.
  • The company received $100M in capital which it can use to fuel future growth.
  • The share price did not rocket upwards on day 1.

Wait a minute, doesn’t everybody judge the success of an IPO by the first-day pop in valuation?  Yes, most people do.  But they’re wrong.  If you look at things from the company’s perspective, the day-one share price “pop” is clearly not the right metric.

Let’s show this by pretending the stock did double to $20 on the first day of trading.  In this case, the company would have sold 100M shares for $10 that were, at its turns out, actually worth $20.

Who wins and loses in the first-day double scenario?

  • The company loses, because it gave away $100M.  Had the shares been properly market-priced at $20, it could have either raised $200M or issued half as many shares (reducing dilution for existing shareholders).
  • Employees lose.  This one’s tricky because people think they are happy.  “Hey, my 10K shares were worth $100K in the IPO and now they are worth $200K!”  The reality is that they were worth $200K all along and employees only believe the price “doubled” because they were psychologically anchored to a price of half their value.
  • The institutional investors who bought in the IPO win.  These people are the usual customers of the investment bankers who underwrite the offering, and quite possibly their buddies from b-school.
  • Anyone else able to get access to some shares in the offering wins.  I’m not sure what happens today, but back in the bubble if you were CEO of another company and had a discretionary account with an underwriter (who was hoping to get your future business) you might well have been allocated some shares in the IPO which were sold on the first day for a nice profit.  (Recall the Meg Whitman issue, where she allegedly netted $1.8M through this practice.)

As my friend Crispin Read once said:  “if you work in a donut shop, you get free donuts; if you work in a bank, you get free money.”  In this example, the $100M gap between the aggregate sale price of the IPO shares and their value at the end of day one  is the closest thing to free money you can find.  And its allocation is controlled not by the company, but by the bankers and presumably to their advantage.

I understand the common counter-arguments to my viewpoint, but disagree with them.

  • If IPO shares don’t pop, then no one will want to buy them.  Hum, seems to me as if billions of shares are traded everyday without the expectation of one-day pops.  Somehow, investors buy all those shares.
  • IPO firms are risky and thus  buyers should expect a higher absolute return.  Yes, I can buy this.  So perhaps a buyer will need to expect a 15-20% first-year return to compensate for this additional risk.  That’s quite different from a 50% first-day return.
  • The IPO shares are actually worth more on IPO day then they were previously.  Indeed, a liquidity premium should apply to the shares — but this should be reflected in the IPO price.  Buyers in the IPO are buying shares that will be publicly traded, and they know it.
  • Thin floats and lock-up periods will make the shares more volatile than “normal” companies in the first six months and thus some discount should apply.  While both of those are true, they again well known and should be priced into the IPO price itself.

I’m not sure what the right first-day pop is.  There is an argument that a 0% pop is ideal — it means the shares were perfectly priced in the IPO roadshow, no free money was created that can be handed out by the bankers, and the company raised funds at the optimal price.  I suppose that’s too idealistic.  My gut feel is that success looks like a 10-20% pop — which, by the way, is still huge compared to typical stock-market investment returns.

But I am certain that the media tradition of weighing IPO success by the size of the first-day pop is misguided.  In the end, if every IPO pops 50% on its first day it simply means that IPO shares are being systematically undervalued, which then prompts the question of who wins and who loses as a result of that undervaluation?

Thoughts on the Jive Registration Statement (S-1) and Initial Public Offering (IPO)

I finally found  some time to read over the approximately 175-page registration statement (S-1) that enterprise social networking software provider Jive Software filed on August 24, 2011 in support of a upcoming initial public offering (IPO) of its stock.

In this post, and subject to my usual disclaimers, I’ll share some of my thoughts on reading the document.

Before jumping into financials, let’s look at their marketing / positioning.

  • Jive positions as a “social business software” company.   Nice and clear.
  • Since everyone now needs a Google-esque (“organize the world’s information”) mission statement, Jive has one:  “to change the way work gets done.”  Good, but is change inherently a benefit?  Not in my book.
  • Jive’s tagline is “The New Way To Business.”  Vapid.
  • Since everyone seems to inexplicably love the the tiny-slice-of-huge-market argument in an IPO, Jive offers up $10.3B as the size of the collaborative applications market in 2013.  That this implies about 2% market share in 2013 at steady growth doesn’t seem to bother anyone.  Whither focus and market dominance?

Now, let’s move to financials.  Here’s an excerpt with the consolidated income statement:

The astute reader will notice a significant change in 2010 when Jive Founder Dave Hersh stepped down as CEO and was replaced with ex-Mercury CEO Tony Zingale.  Let’s make it easier to see what’s going by adding some ratios:

Translating some of the highlighted cells to English:

  • Jive does not make money on professional services:  they had a -17% gross margin 2010 and -13% gross margin in 1H11.
  • In 2009,  a very difficult year, Jive grew total revenue 77% and did so with a -15% return on sales.
  • In 2010, Jive grew revenue 54% with a -60% return on sales, while in 1H11, Jive grew revenue 76% with a -64% return on sales.
  • In 2010, Jive increased R&D, S&M, and G&A expense by 127%, 103%, and 132% respectively.
  • In 2010, Jive had a $27.6M operating loss, followed by a $30.6M operating loss 1H11

To say that Jive is not yet profitable is like saying the Tea Party is not yet pro-taxation.  For every $1.00 in revenue Jive earned in 1H11, they lost $0.90. People quipped that the Web 1.0 business model was “sell dollars for ninety cents.”  Jive seems to be selling them for about fifty-three.

But that analysis is unduly harsh if you buy into the bigger picture that:

  • This is the dawn of a large opportunity; a land-grab where someone is going to take the market.
  • You assume that once sold, there are reasonably high switching costs to prevent a customer from defecting to a competitive service.
  • These are subscription revenues.  Buying $1.00 of revenue for $1.90 is foolish on a one-shot deal, but in this case they’re buying a $1.00 annuity per year.  In fact, if you read about renewal rates later on in the prospectus, they’re actually paying $1.90 for a $1.00 annuity that grows at 25% per year.

I’d say this is a clear example of a go-big-or-go-home strategy.  You can see the strategic tack occurring in 2010, concurrent with the management change.  And, judging by the fact that they’re filing an S-1, it appears to be working.

Before moving on, let’s look at some ratios I calculated off the income statement:

You can see the strategy change in the highlighted cells.

  • Before the change, Jive spent $1.16 to get a dollar of revenue.  After, they spent $1.90.
  • Before, they got $2.91 of incremental revenue per incremental operating expense.  After, they got $0.90.  (It looks similar on a billings basis.)
  • Before, they got $6.76 of incremental product revenue per incremental S&M dollar.  After, they got $1.73.

Clearly, the change was not about efficiency.  You could argue that it was either about growth-at-all-costs or, more strategically, about growth as a landgrab.

But we’re only on page 6 of the prospectus, so we’re going to need to speed up.

Speaking of billings and revenues, let’s hear what Jive has to say:

We consider billings a significant leading indicator of future recognized revenue and cash inflows based on our business model of billing for subscription licenses annually and recognizing revenue ratably over the subscription term. The billings we record in any particular period reflect sales to new customers plus subscription renewals and upsell to existing customers, and represent amounts invoiced for product subscription license fees and professional services. We typically invoice the customer for subscription license fees in annual increments upon initiation of the initial contract or subsequent renewal. In addition, historically we have had some arrangements with customers to purchase subscription licenses for a term greater than 12 months, most typically 36 months, in which case the full amount of the agreement will be recognized as billings if the customer is invoiced for the entire term, rather than for an annual period.

The following table sets forth our reconciliation of total revenues to billings for the periods shown:

This says that billings is equal to revenue plus the change in deferred revenue.  Billings is a popular metric in SaaS companies, though often imputed by financial analysts, because revenue is both damped and seen as a dependent variable.  Billings is seen as the purer (and more volatile) metric and thus seen by many as a superior way to gauge the health of the business.

For Jive, from a growth perspective, this doesn’t strike me as particularly good news since billings, which were growing 99% in 2010, are growing at 59% in 1H11, compared to revenue which is growing at 76%.

Now we’re on page 8.  Happily the next 20 pages present a series of valid yet unsurprisingly risk factors that I won’t review here, though here are a few interesting extracted tidbits:

  • The company had 358 employees as of 6/30/11.
  • They plan to move from third-party hosted data centers to their own data centers.
  • Subscription agreements typically range from 12 to 36 months.
  • They do about 20% of sales internationally.
  • They recently completed three acquisitions (FiltrboxProximal,  OffiSync).
  • There is a 180 day lockup period following the offering.

Skipping out of page-by-page mode, let me pull some other highlights from the tome.

  • There were 44M shares outstanding on 6/30/11, excluding 15M options, 0.8M in the options pool, 0.9M shares subject to repurchase.  That, by my math, means ~59M fully-diluted shares outstanding after the offering.
  • Despite having $44.6M in cash on 6/30/11, they had a working capital deficit of $15.9M.
  • The Jive Engage Platform was launched in February 2007.  In August 2007, the company raised its first external capital.
  • The Jive Engage Platform had 590 customers as of 12/31/10, up from 468 at 12/31/09.  There were 635 as of 6/30/11.
  • The dollar-based renewal rate, excluding upsell, for 1H11 for transactions > $50K was over 90%.  Including upsell, the renewal rate was 125%.
  • Public cloud deployments represented 59% of product revenues in 1H11.
  • The way they recognize revenue probably hurts the professional services performance because they must ratably take the PSO revenue while taking the cost up-front.

One thing soon-to-be-public companies need to do is gradually align the common stock valuation with the expected IPO price to avoid a huge run-up in the weeks preceding the IPO.  Gone are the days where you can join a startup, get a rock-bottom strike price on your options, and then IPO at ten times that a few weeks later.  Companies now periodically do section 409a valuations in order to establish a third-party value for the common stock.  Here’s a chart of those valuations for Jive, smoothed to a line, over the 18 months prior to the filing.

This little nugget was interesting on two levels, bolded:

The core application of the Jive Engage Platform is written in Java and is optimized for usability, performance and overall user experience. It is designed to be deployed in the production environments of our customers, runs on top of the Linux operating system and supports multiple databases, including Microsoft SQL Server, MySQL, Oracle and PostgreSQL. The core application is augmented by externally hosted web-based services such as a recommendation service and an analytics service. We have made investments in consolidating these services on a Hadoop-based platform.

First, it seems to suggest that it’s not written for the cloud / multi-tenancy (which, if true, would be surprising) and second, it suggests that they are investigating Hadoop which is cool (and not surprising).

More tidbits:

  • 105 people in sales as of 6/30/11
  • 122 people in R&D as of 6/30/11
  • Executives Tony Zingale (CEO), Bryan LeBlanc (CFO), John McCracken (Sales), and Robert Brown (Client Services) all worked at Mercury Interactive.  The latter three were brought in after Zingale was made a director (10/07) but well before he was appointed CEO (2/10).
  • Zingale beneficially owns 7.5% of the company pre-offering.  This is high by Silicon Valley standards, but he’s a big-fish CEO in a small-pond company.
  • Sequoia Capital beneficially owns 36% of the company.  Kleiner Perkins owns 14%.
  • I think Sequoia contributed $37M of the $57M total VC raised (though I can only easily see $22M in the S-1).
  • If that’s right, and if Sequoia eventually exits Jive at a $1B market cap, that means they will, on average across funds, get a ~10x return on their investment.  $2B would give them 20x.

What’s left of my brain has officially melted at page F-11.  If I dig back in and find anything interesting, I’ll update the post.  Meantime, if you have questions or comments, please let me know.

As a final strategic comment, I’d say that investors should consider the possibility of an increased level of competition from Salesforce.com, given their massive push around “the social enterprise” at Dreamforce 11.

Thoughts on the Qlik Technologies (QlikTech) IPO

I spent an hour or so browsing the QlikTech S-1 and thought I’d share some observations.  (See here for my prior post on the company.)

  • The company has achieved good scale (2009 revenues of $157M) but growth has been decelerating from 82% in 2007 to 47% in 2008 to 33% in 2009.
  • Gross margins are high at 89% due largely to normal margins on license (96%), unusually  high margins on support (96%), normal margins on consulting (27%), and a fairly small consulting business (10% of total revenues) which reduces the pull-down effect on the weighted average.  Wall Street will like this.
  • Sales and marketing expense is high at 59% of sales.  Provided switching costs are high, you can argue this is a good investment, and provided growth is high, you can justify it.   I’m going to assume they make some “lost year” arguments about 2009 in their story and will guide to re-accelerated growth, but I’m not sure.  If not, then they will get pressure about the inefficiency of their sales model.
  • R&D is spectacularly low at 6% of sales.  There is an argument that if you have a largely completed (cheap and cheerful) BI tool that you should simply go sell the heck out of it and not artificially spend money in R&D when you have neither the vision nor the immediate need to either create new products or investment big money in enhancing your existing one.  I’ve just seen few companies try to make it.  I suspect Wall St. will pressure them to increase this number, regardless of whether it’s the strategically right thing to do for the company.
  • Expanded customer base from 1,500 customers in 2005 to over 13,000 in 2009.
  • I like their argument that because it’s easier to use than traditional BI tools that it should get greater penetration than the average 28% of potential BI users cited by IDC.
  • The unique business model (free downloads and 30-day guarantee post purchase) are consistent with the cheap and cheerful product positioning, which is good.  It does beg the question why sales costs so much, however, if you’re primarily upselling downloaders in a low-commitment fashion.
  • I think the claim “analysis tools are not designed for business users” is over-stated.  I can assure you that at BusinessObjects we were designing products for business users.
  • I dislike the small piece of huge pie argument, but I suppose that particular fallacy is so embedded in human nature that it will never go away.  I’d rather hear that QlikTech thinks its 2010 potential market is $400M and it wants 50% than hear – as it says in the prospectus — that they think it’s $8.6B and they presumably want somewhere around 2%.
  • They expect 63M shares outstanding after the offering, implying that if they want a $10-$15 share price that they think the company can justify a market cap in the $750M to $1B range.  If it were generating more than a 4% return on sales and growing faster than 33% that would be easier to assume.
  • 50% of 2009 license and FYM came from indirect channels.  This again begs the question why sales cost so much; indirect channels are, in theory, more cost-effective than direct.
  • They had 124 “dedicated direct sales professionals” as of 12/31/09, which suggests to me that at an average productivity of $1.8M (including all ramping and turnover effects) they could do $223M in revenues in 2010, or growth in the 40% range.  So they seem well teed-up from a sales hiring perspective.
  • If my US readers are wondering why you’ve not heard of them, it’s because they were originally founded in Sweden and do 77% of revenues “internationally” (which now means outside the US given that they moved their headquarters in 2004).   This relative lack of US presence should presumably hurt the stock.
  • They have a pretty traditional enterprise software business model:  perpetual license and maintenance.  They even state potential demand for SaaS BI as a risk factor.
  • They had $35M in deferred revenue on the balance sheet as of 12/31/09.  This strikes me as high; some quick back-of-the-envelope calculations led me to expect ~$25M if it was all the undelivered portion of pre-paid, single-year maintenance contracts.
  • Per IDC, 44% of QlikView customers deploy within a month and 77% deploy within three months.  It sounds impressive and is consistent with the small consulting business.  But it also depends on the definition of deploy.
  • This is no overnight success story; the company was founded in Sweden in 1993.  There was a six-year product development phase (which perhaps explains the low R&D today) from 1993 to 1999.  From 1999 to 2004 they sold almost exclusively in Europe.  From 2004, they added USA sales and relocated the HQ to Pennsylvania.
  • 2009 maintenance renewal rate of 85%
  • They intend to increase R&D expenses to increase in both absolute dollars and as a percent of sales going forward.
  • 73% of revenues are not dollar denominated.  This means that foreign exchange rates should hit them more (both ways) than for a typical software company.
  • This sounds typical:

Our quarterly results reflect seasonality in the sale of our products and services. Historically, a pattern of increased license sales in the fourth quarter has positively impacted sales activity in that period which can make it difficult to achieve sequential revenue growth in the first quarter. Similarly, our gross margins and operating income have been affected by these historical trends because the majority of our expenses are relatively fixed in the near-term.

  • USA revenues grew at 28% in 2009, a bit slower than company overall. Fairly surprising, given the late USA start and the presumably huge market opportunity.
  • R&D remains in Lund, Sweden with 54 staff as of 12/31/09.
  • 574 total employees as of 12/31/09 with 148 in the USA and 426 outside.
  • Accel is the biggest shareholder with 26.7% of the stock, pre-offering.
  • The proposed ticker symbol is QLIK
  • My brain started to melt around page 120.  (Somehow the document set I managed to pull down from the SEC site is about1,000 pages and includes a zillion appendices.  The regular S-1 is here.)
  • Click on the image below to blow up their recent financials.