AI
On the Socially Acceptable Use of AI in Business
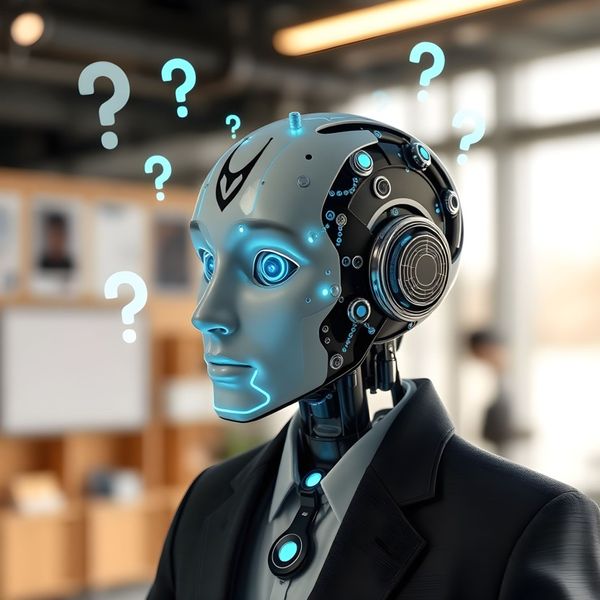
There's a question I've been mulling for a while now, and I think it's time to write it down: when is it okay to use generative AI in a given business context, and when does it cross a line? I'll focus on