After the SaaSacre of early 2016, investors generally backed off a growth-at-all-costs mindset and started to value SaaS companies using an “appropriate” balance of growth and profitability. The question then became, what’s appropriate? The answer was: the rule of 40 [1].
What’s the rule of 40? Growth rate + profit should be greater than or equal to 40%.
There are a number of options for deciding what to use to represent growth (e.g., ARR) and profit (e.g., EBITDA, operating margin). For public companies it usually translates to revenue growth rate and free cash flow margin.
It’s important to understand that such “rules” are not black and white. As we’ll see in a minute, lots of companies deviate from the rule of 40. The right way to think about these rules of thumb is as predictors. Back in the day, what best predicted the value of a SaaS company? Revenue growth — without regard for margin. (In fact, often inversely correlated to margin.) When that started to break down, people started looking for a better independent variable. The answer to that search was the rule of 40 score.
Let’s examine a few charts courtesy of the folks at Pacific Crest and as presented at the recent, stellar Zuora CFO Forum, a CFO gathering run alongside their Subscribed conference.
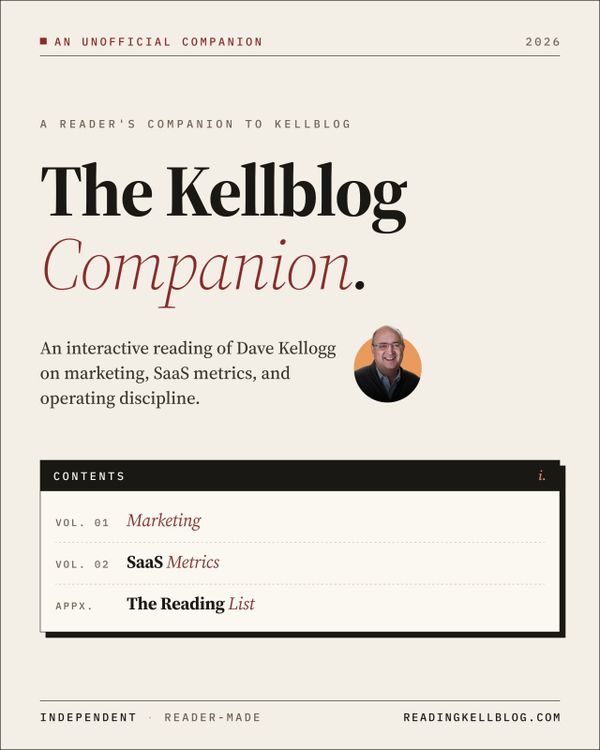
This scatter chart plots the two drivers of the rule of 40 score against each other, colors each dot with the company’s rule of 40 score, and adds a line that indicates the rule of 40 boundary. 42% of public SaaS companies, and 77% of public SaaS market cap, is above the rule of 40 line.
As a quick demonstration of the exception-to-every-rule principle, Tintri recently went public off 45% growth with -81% operating margins, [2] reflecting a rule of 40 score of -36%, and a placement that would be off the chart (in the underneath sense) even if corrected for non-cash expenses.
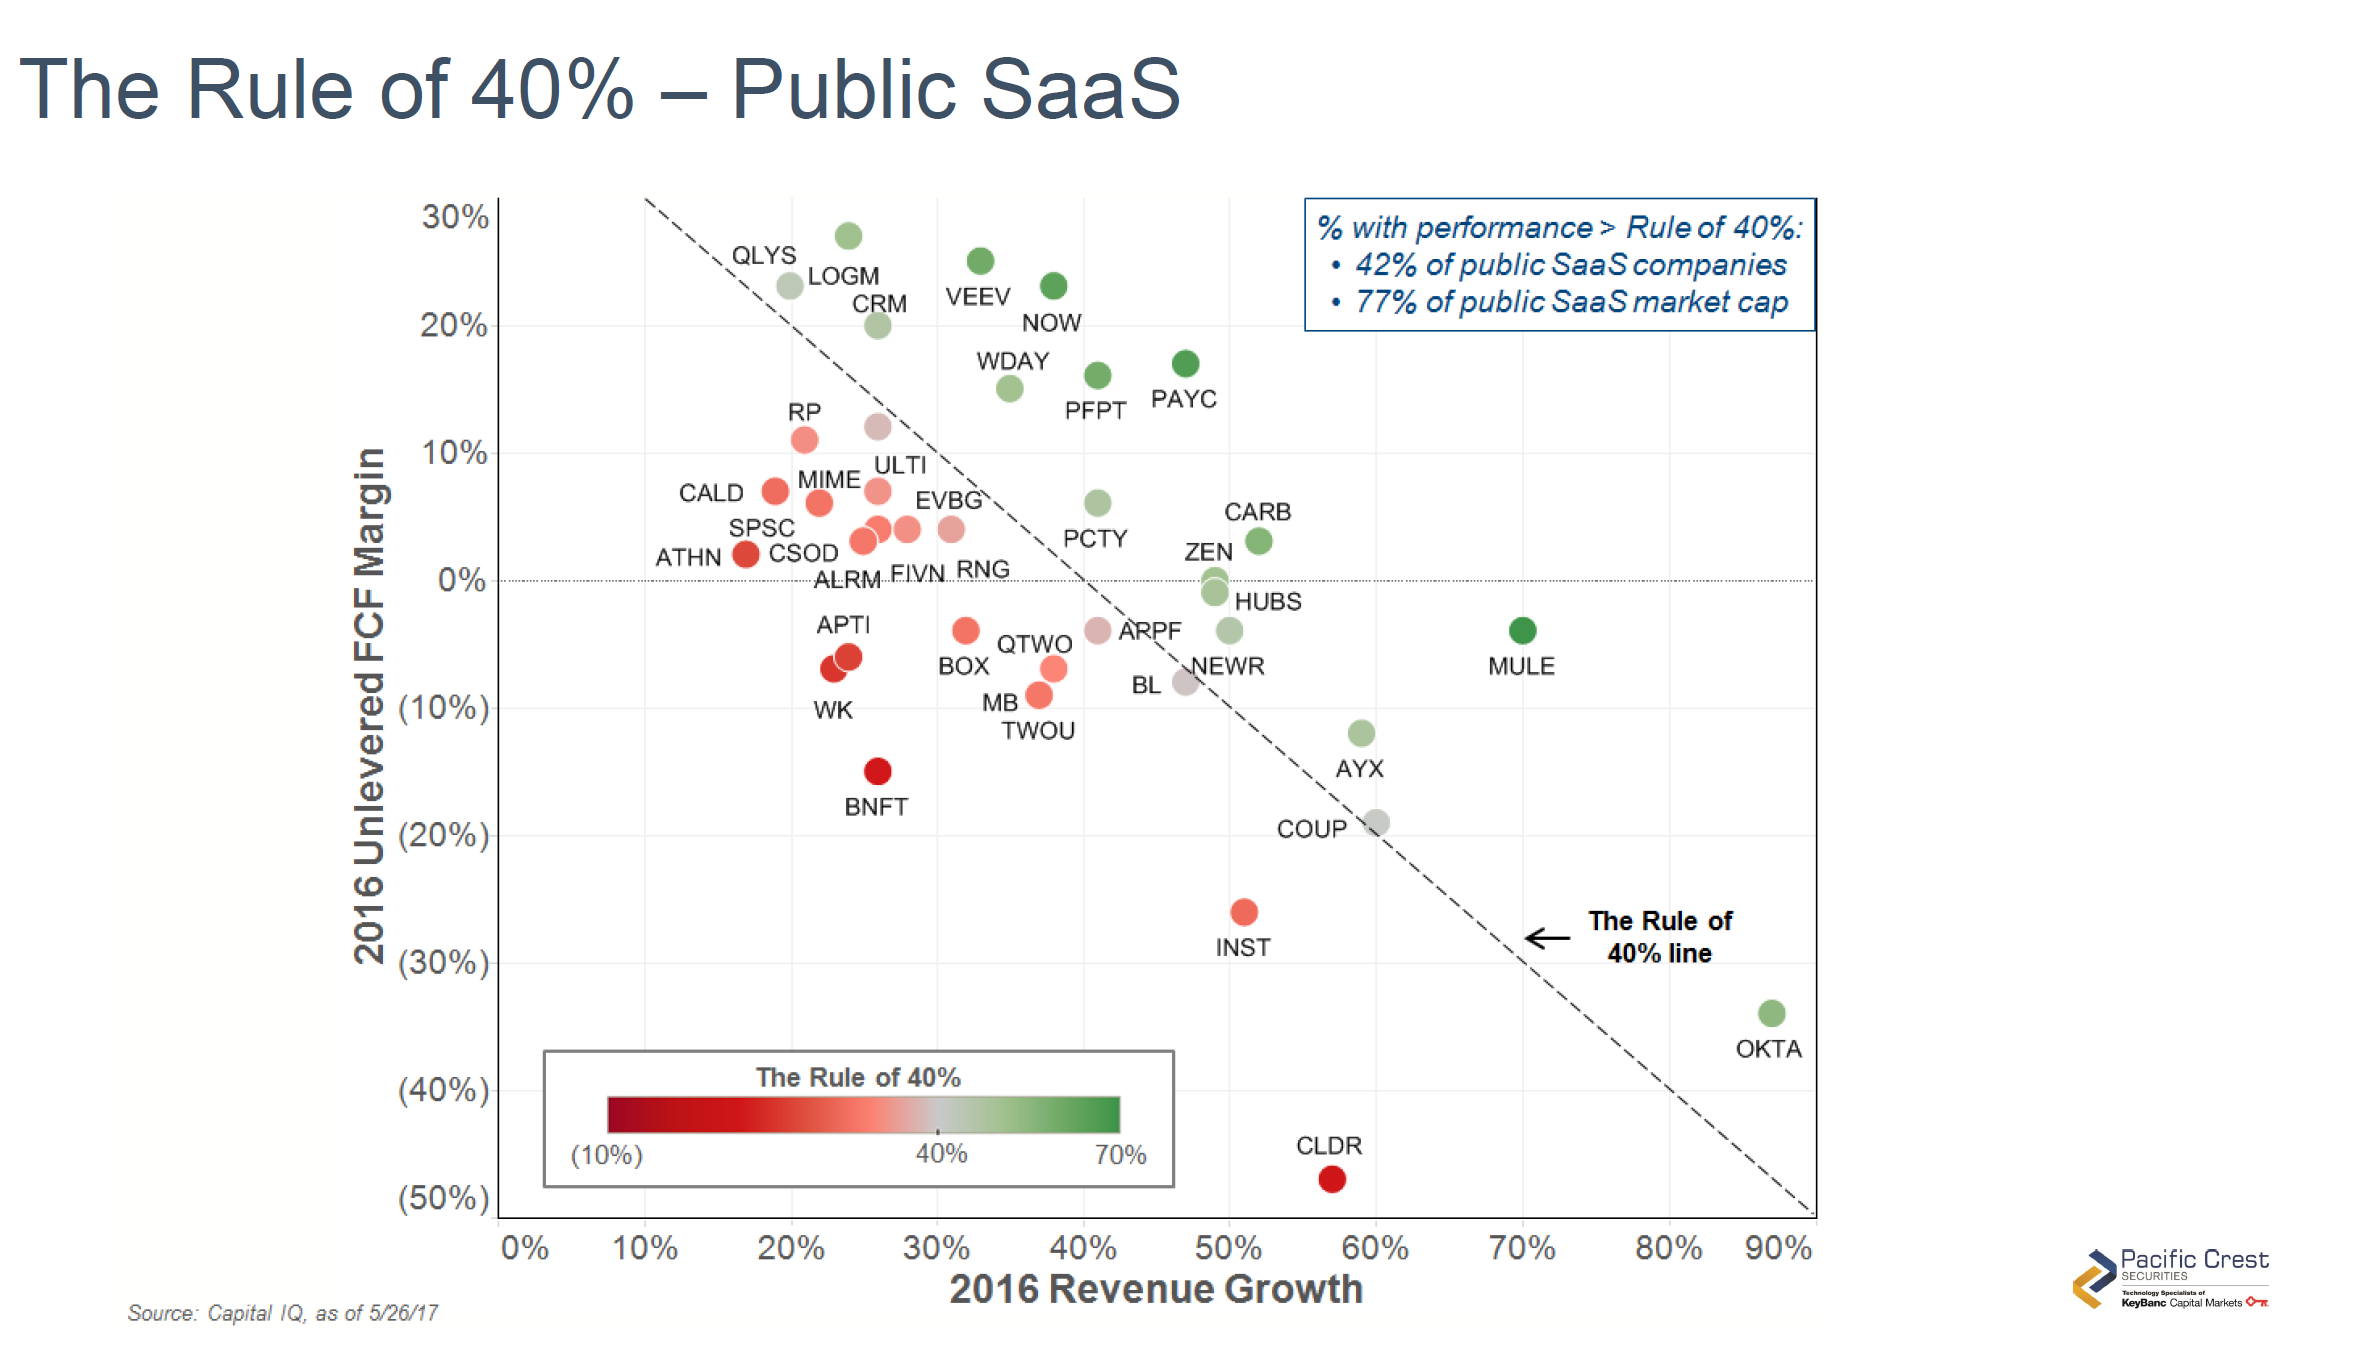
For those interested in company valuations, the more interesting chart is this one.
This chart plots rule of 40 score on the X axis, valuation multiple on the Y axis, and produces a pretty good regression line the shows the relationship between the two. In short, the rule of 40 alone explains nearly 50% of SaaS company valuation. I believe that outliers fall into one of two categories:
- Companies in a strategic situation that explains the premium or discount relative to the model — e.g., the premium for Cloudera’s strong market position in the Hadoop space.
- Companies whose valuations go non-linear at the high end due to scarcity — e.g., Veeva.
Executives and employees at startups should understand [3] the rule of 40 as it explains the general tendency of SaaS companies to focus on a balance of growth and profitability as opposed to a growth at all costs strategy that was more popular several years back. Ignore the rule of 40 at your peril.
Notes
[1] While the Rule of 40 concept preceded the SaaSacre, I do believe that the SaaSacre was the wake-up call that made more investors and companies pay attention to.
[2] Using operating margin here somewhat lazily as I don’t want to go find unlevered free cash flow margin, but I don’t think it materially changes the point.
[3] Other good rule of 40 posts are available from: Tomasz Tungaz, Sundeep Peechu, and Jeff Epstein and Josh Harder.
What are your thoughts on the Rule of 40 for private firms wishing to grow several more years before even thinking about an exit?
Seems like The SaaS Rule of 40 (or even 30) could sink a balance sheet (potentially). Maybe I’m answering my own question, but using free cash flow in place of profit makes the most sense if a smaller SaaS entity wants to hit that 40 benchmark.
I view these things as “glide slopes.” If you know you want to be be at position X at time T, then where do you need to be now in order to make that happen. More concretely, using financial planning and modeling tools (shameless self plug) you can build, say, a 3-5 year financial model that puts you on the track to end up where you want to be. That means, e.g., at a smaller business you might emphasize growth over profit (and produce a potentially lower rule-of-40 score, but as you get bigger that you want to be more in line.
Pingback: Rule of 40: A Model for Investing in Public SaaS Companies – The Lien Startup
Pingback: A Rule of 40 walkthrough - Hi, I'm David G. Cohen
Pingback: Why Public SaaS Financial Benchmarks for Sales and Marketing Expense Don’t Tell the Story - OPEXEngine
Pingback: Top Kellblog Posts of 2018 | Kellblog
Pingback: An Update on the SaaS Rule of 40 | Kellblog
Pingback: An Update on the SaaS Rule of 40 - Enterprise Irregulars
Pingback: Rule of 40 Glideslope Planning | Kellblog
Pingback: Rule of 40 Glideslope Planning - Enterprise Irregulars
Pingback: How Product Managers Measure Product-Market Fit
Pingback: How Product Managers Measure Product-Market Match
At what size of company does the rule of 40 start mattering?
That’s a big topic of debate. Imho, it matters most once you’re already public. About half of public companies aren’t R40 complaint (though the ones that are command most of the market cap). For small / private companies, I think boards apply pressure around rule of 40 that is either misguided or a smokescreen (they want to cut the burn because they don’t believe the growth will ensue — and it’s easier to say rule of 40 than I don’t trust your growth forecast)
Pingback: The Rule of 40 — Down, But Not Out! | Kellblog
Pingback: The Rule of 40 — Down, But Not Out! - Enterprise Irregulars
How would you consider M&A activities when evaluating the growth part in the rule of 40?
It’s inorganic growth but it comes with real costs so I think you can simply look at it as normal — understanding that after 4 growths the inorganic growth tailwind wears off.
Dear Dave, your analysis is great, i would like to plot my start up on your chart for my investors , and was wondering if you could share a less blured version of the 2 charts you present here ? Thx !
Yes, I’m having trouble with image quality. Please download the spreadsheet from the link at the bottom and you can get your own crystal clear screenshots. Right now, I’m having more fundamental issues with the blog as WordPress desupported my template. Once I fix all those problems, then I’ll come back to image quality. Meantime, grab the spreadsheet https://www.scribd.com/document/433059986/Opportunity-Histogram
Pingback: Dave Kellogg Addresses The Rule of 40, EPM, SaaS Metrics, and More
This is such a great article, it really spells out the mantra for an SAAS company.
Pingback: Innovative Approaches to Finance Management: Lessons from the Software Industry – MarketFools.com
Pingback: Innovative Approaches to Finance Management: Lessons from the Software Industry – TrendingNZ.co.nz
Pingback: Innovative Approaches to Finance Management: Lessons from the Software Industry – Chambers Federation