Why Every Startup Needs an Inverted Demand Generation Funnel, Part I

Does my company spend too much on marketing? Too little? How I do know? What is the right level of marketing spend at an enterprise software startup? I get asked these questions all the time by startup CEOs, CMOs, marketing VPs, and marketing directors.
You can turn to financial benchmarks, like the KeyBanc Annual SaaS Survey for some great high-level answers. You can subscribe to SiriusDecisions for best practices and survey data. Or you can buy detailed benchmark data [1] from OPEXEngine. These are all great sources and I recommend them heartily to anyone who can afford them.
But, in addition to sometimes being too high-level [2], there is one key problem with all these forms of benchmark data: they're not about you. They're not based on your operating history. While I certainly recommend that executives know their relevant financial benchmarks, there's a difference between knowing what's typical for the industry and what's typical for you.
So, if you want to know if your company is spending enough on marketing [3], the first thing you should do is to make an inverted demand generation (aka, demandgen) funnel to figure out if you're spending enough on demandgen. It's quite simple and I'm frankly surprised how few folks take the time to do it.
Here's an inverted demandgen funnel in its simplest form:
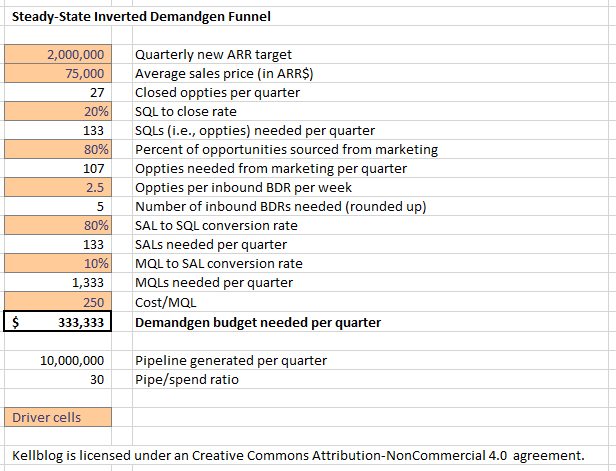
Let's walk through the model. Note that all orange cells are drivers (inputs) and the white cells are calculations (outputs). This model assumes a steady-state situation [4] where the company's new ARR target is $2,000,000 each quarter. From there, we simply walk up the funnel using historical deal sizes and conversion rates [5].
- With an average sales price (ASP) of $75,000, the company needs to close 27 opportunities each quarter.
- With a 20% sales qualified lead (SQL) to close rate we will need 133 SQLs per quarter.
- If marketing is responsible for generating 80% of the sales pipeline, then marketing will need to generate 107 of those SQLs.
- If our sales development representatives (SDRs) can output 2.5 opportunities per week then we will need 5 SDRs (rounding up).
- With an 80% SAL to SQL conversion rate we will need 133 SALs per quarter.
- With a 10% MQL to SAL conversion rate we will need 1,333 MQLs per quarter.
- With a cost of $250 per MQL, we will need a demandgen budget [6] of $333,333 per quarter.
The world's simplest way to calculate the overall marketing budget at this point would be to annualize demandgen to $1.3M and then double it, assuming the traditional 50/50 people/programs ratio [7].
Not accounting for phase lag or growth (which will be the subjects of part II and part III of this post), let's improve our inverted funnel by adding benchmark and historical data.
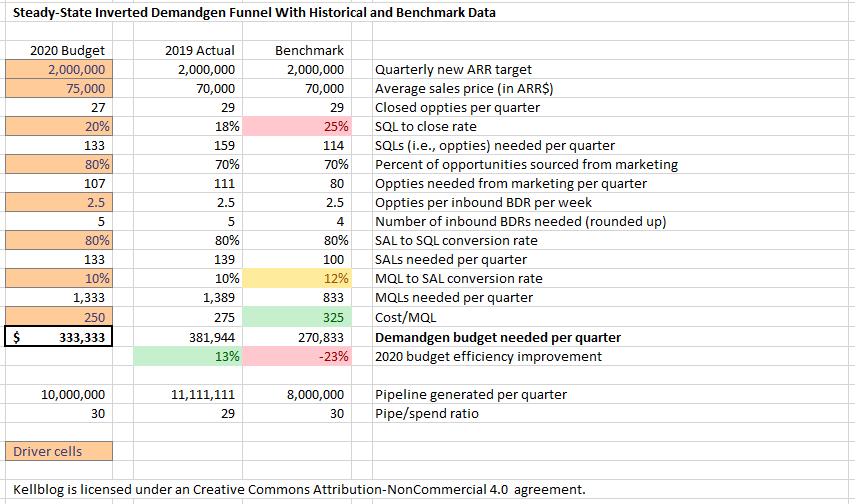
Let's look at what's changed. I've added two columns, one with 2019 actuals and one with benchmark data from our favorite source. I've left the $2M target in both columns because I want to compare funnels to see what it would take to generate $2M using either last year's or our benchmark's conversion rates. Because I didn't want to change the orange indicators (of driver cells) in the left column, when we have deviations from the benchmark I color-coded the benchmark column instead. While our projected 20% SQL-to-close rate is an improvement from the 18% rate in 2019, we are still well below the benchmark figure of 25% -- hence I coded the benchmark red to indicate a problem in this row. Our 10% MQL-to-SQL conversion rate in the 2020 budget is a little below the benchmark figure of 12%, so I coded it yellow. Our $250 cost/MQL is well below the benchmark figure of $325 so I coded it green.
Finally, I added a row to show the relative efficiency improvement of the proposed 2020 budget compared to last year's actuals and the benchmark. This is critical -- this is the proof that marketing is raising the bar on itself and committed to efficiency improvement in the coming year. While our proposed funnel is overall 13% more efficient than the 2019 funnel, we still have work to do over the next few years because we are 23% less efficient than we would be if we were at the benchmark on all rates.
However, because we can't count on fixing everything at once, we are taking a conservative approach where we show material improvement over last year's actuals, but not overnight convergence to the benchmark -- which could take us from kaizen-land to fantasy-land and result in a critical pipeline shortage downstream.
Moreover because this approach shows not only a 13% overall efficiency improvement but precisely where you expect it to come from, the CEO can challenge sales and marketing leadership:
- Why are we expecting to increase our ASP by $5K to $75K?
- Why do you think we can improve the SQL-to-close rate from 18% to 20% -- and what you are doing to drive that improvement? [8]
- What are we doing to improve the MQL-to-SAL conversion rate?
- How are we going to improve our already excellent cost per MQL by $25?
In part II and part III of this post, we'll discuss two ways of modeling phase-lag, modeling growth, and the separation of the new business and upsell funnels.
You can download my spreadsheet for this post, here.
Notes
[1] For marketing or virtually anything else.
[2] i.e., looking at either S&M aggregated or even marketing overall.
[3] The other two pillars of marketing are product marketing and communications. The high-level benchmarks can help you analyze spend on these two areas by subtracting your calculated demandgen budget from the total marketing budget suggested by a benchmark to see "what's left" for the other two pillars. Caution: sometimes that result is negative!
[4] The astute reader will instantly see two problems: (a) phase-lag introduced by both the lead maturation (name to MQL) and sales (SQL to close) cycles and (b) growth. That is, in a normal high-growth startup, you need enough leads not to generate this quarter's new ARR target but the target 3-4 quarters out, which is likely to be significantly larger. Assuming a steady-state situation gets rid of both these problems and simplifies the model. See part II and part III of this post for how I like to manage that added real-world complexity.
[5] Hint: if you're not tracking these rates, the first good thing about this model is that it will force you to do so.
[6] When I say demandgen budget, I mean money spent on generating leads through marketing campaigns. Sometimes that very directly (e.g., adwords). Other times it's a bit indirectly (e.g., an SEO program). I do not include demandgen staff because I am trying to calculate the marginal cost of generating an extra MQL. That is, I'm not trying to calculate what the company spends, in total, on demandgen activities (which would include salary, benefits, stock-based comp, etc. for demandgen staff) but instead the marketing programs cost to generate a lead (e.g., in case we need to figure out how much to budget to generate 200 more of them).
[7] In an increasingly tech-heavy world where marketing needs to invest a lot in infrastructure as well, I have adapted the traditional 50/50 people/programs rule to a more modern 45/45/10 people/programs/infrastructure rule, or even an infrastructure-heavy split of 40/40/20.
[8] Better closing tools, an ROI calculator, or a new sales training program could all be valid explanations for assuming an improved close rate.