The software-as-a-service (SaaS) space is full of seemingly simple metrics that can quickly slip through your fingers when you try to grasp them. For example, see Measuring SaaS Renewals Rates: Way More Than Meets the Eye for a two-thousand-word post examining the many possible answers to the seemingly simple question, “what’s your renewal rate?”
In this post, I’ll do a similar examination to the slightly simpler question, “what’s your customer acquisition cost (CAC) ratio?”
I write these posts, by the way, not because I revel in the detail of calculating SaaS / cloud metrics, but rather because I cannot stand when groups of otherwise very intelligent people have long discussions based on ill-defined metrics. The first rule of metrics is to understand what they are and what they mean before entertaining long discussions and/or making important decisions about them. Otherwise you’re just counting angels on pinheads.
The intent of the CAC ratio is to determine the cost associated with acquiring a customer in a subscription business. When trying to calculate it, however, there are six key issues to consider:
- Months vs. years
- Customers vs. dollars
- Revenue on top vs. bottom
- Revenue vs. gross margin
- The cost of customer success
- Time periods of S&M
Months vs. Years
The first question — which relates not only to CAC but also to many other SaaS metrics: is your business inherently monthly or annual?
Since the SaaS movement started out with monthly pricing and monthly payments, many SaaS businesses conceptualized themselves as monthly and thus many of the early SaaS metrics were defined in monthly terms (e.g., monthly recurring revenue, or MRR).
While for some businesses this undoubtedly remains true, for many others – particularly in the enterprise space – the real rhythm of the business is annual. Salesforce.com, the enterprise SaaS pioneer, figured this out early on as customers actually encouraged the company to move to an annual rhythm, for among other reasons, to avoid the hassle associated with monthly billing.
Hence, many SaaS companies today view themselves as in the business of selling annual subscriptions and talk not about MRR, but ARR (annual recurring revenue).
Customers vs. Dollars
If you ask some cloud companies their CAC ratio, they will respond with a dollar figure – e.g., “it costs us $12,500 to acquire a customer.” Technically speaking, I’d call this customer acquisition cost, and not a cost ratio.
There is nothing wrong with using customer acquisition cost as a metric and, in fact, the more your business is generally consistent and the more your customers resemble each other, the more logical it is to say things like, “our average customer costs $2,400 to acquire and pays us $400/month, so we recoup our customer acquisition cost in six months.”
However, I believe that in most SaaS businesses:
- The company is trying to run a “velocity” and an “enterprise” model in parallel.
- The company may also be trying to run a freemium model (e.g., with a free and/or a low-price individual subscription) as well.
Ergo, your typical SaaS company might be running three business models in parallel, so wherever possible, I’d argue that you want to segment your CAC (and other metric) analysis.
In so doing, I offer a few generic cautions:
- Remember to avoid the easy mistake of taking “averages of averages,” which is incorrect because it does not reflect weighting the size of the various businesses.
- Remember that in a bi-modal business that the average of the two real businesses represents a fictional mathematical middle.

For example, the “weighted avg” column above is mathematically correct, but it contains relatively little information. In the same sense that you’ll never find a family with 1.8 children, you won’t find a customer with $12.7K in revenue/month. The reality is not that the company’s average months to recoup CAC is a seemingly healthy 10.8 – the reality is the company has one very nice business (SMB) where it takes only 6 months to recoup CAC and one very expensive one where it takes 30. How you address the 30-month CAC recovery is quite different from how you might try to squeeze a month or two out the 10.8.
Because customers come in so many different sizes, I dislike presenting CAC as an average cost to acquire a customer and prefer to define CAC as an average cost to acquire a dollar of annual recurring revenue.
Revenue on Top vs. Bottom
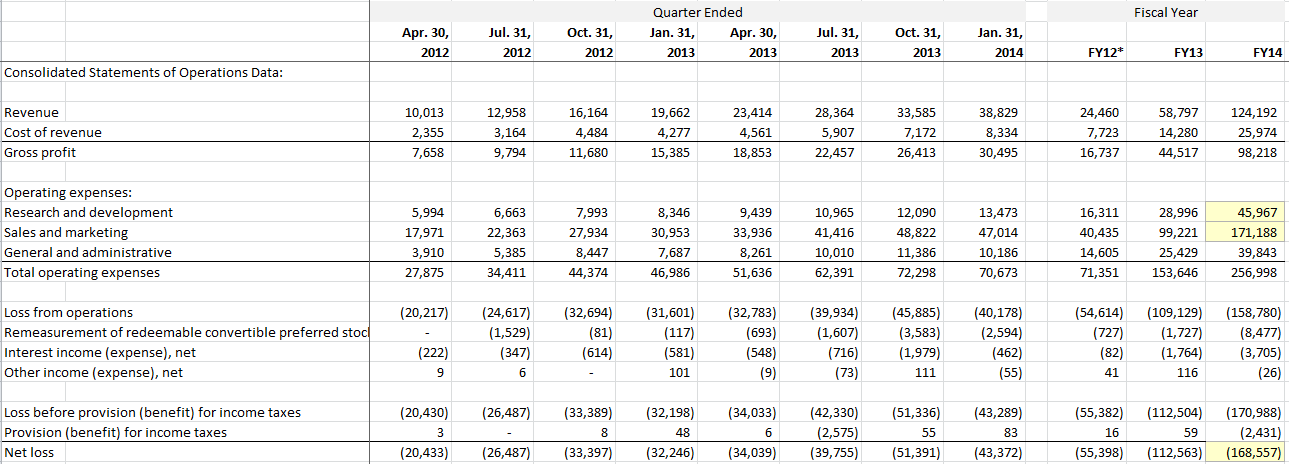
When I first encountered the CAC ratio is was in a Bessemer white paper, and it looked like this.

In English, Bessemer defined the 3Q08 CAC as the annualized amount of incremental gross margin in 3Q08 divided by total S&M expense in 2Q08 (the prior quarter).
Let’s put aside (for a while) the choice to use gross margin as opposed to revenue (e.g., ARR) in the numerator. Instead let’s focus on whether revenue makes more sense in the numerator or the denominator. Should we think of the CAC ratio as:
- The amount of S&M we spend to generate $1 of revenue
- The amount of revenue we get per $1 of S&M cost
To me, Bessemer defined the ratio upside down. The customer acquisition cost ratio should be the amount of S&M spent to acquire a dollar of (annual recurring) revenue.
Scale Venture Partners evidently agreed and published a metric they called the Magic Number:
Take the change in subscription revenue between two quarters, annualize it (multiply by four), and divide the result by the sales and marketing spend for the earlier of the two quarters.
This changes the Bessemer CAC to use subscription revenue, not gross margin, as well as inverts it. I think this is very close to CAC should be calculated. See below for more.
Bessemer later (kind of) conceded the inversion — while they side-stepped redefining the CAC, per se, they now emphasize a new metric called “CAC payback period” which puts S&M in the numerator.
Revenue vs. Gross Margin
While Bessemer has written some great papers on Cloud Computing (including their Top Ten Laws of Cloud Computing and Thirty Q&A that Every SaaS Revenue Leader Needs to Know) I think they have a tendency to over-think things and try to extract too much from a single metric in defining their CAC. For example, I think their choice to use gross margin, as opposed to ARR, is a mistake.
One metric should be focused on measuring one specific item. To measure the overall business, you should create a great set of metrics that work together to show the overall state of affairs.

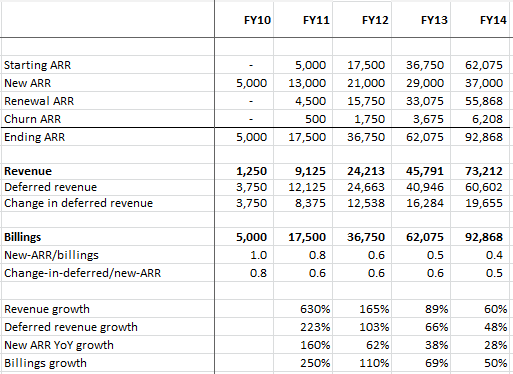
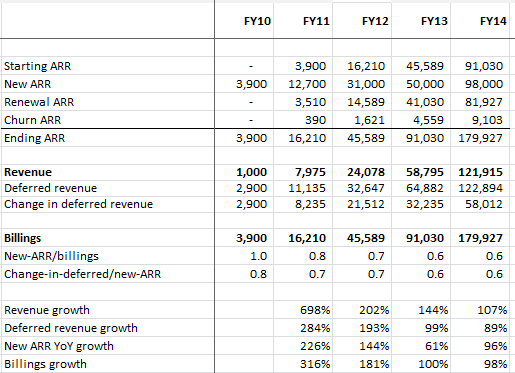
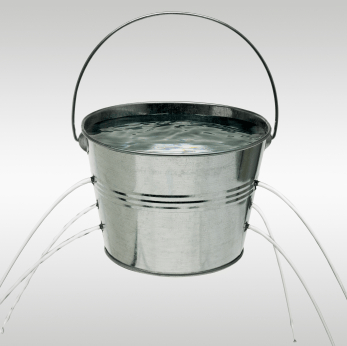
I think of a SaaS company as a leaky bucket. The existing water level is a company’s starting ARR. During a time period the company adds water to the bucket in form of sales (new ARR), and water leaks out of the bucket in the form of churn.
- If you want to know how efficient a company is at adding water to the bucket, look at the CAC ratio.
- If you want to know what happens to water once in the bucket, look at the renewal rates.
- If you want to know how efficiently a company runs its SaaS service, look at the subscription gross margins.
There is no need to blend the efficiency of operating the SaaS service with the efficiency of customer acquisition into a single metric. First, they are driven by different levers. Second, to do so invariably means that being good at one of them can mask being bad at the other. You are far better off, in my opinion, looking at these three important efficiencies independently.
The Cost of Customer Success
Most SaaS companies have “customer success” departments that are distinct from their customer support departments (which are accounted for in COGS). The mission of the customer success team is to maximize the renewals rate – i.e., to prevent water from leaking out of the bucket – and towards this end they typically offer a form of proactive support and adoption monitoring to ferret out problems early, fix them, and keep customers happy so they will renew their subscriptions.
In addition, the customer success team often handles basic upsell and cross-sell, selling customers additional seats or complementary products. Typically, when a sale to an existing customer crosses some size or difficultly threshold, it will be kicked back to sales. For this reason, I think of customer success as handling incidental upsell and cross-sell.
The question with respect to the CAC is what to do with the customer success team. They are “sales” to the extent that they are renewing, upselling, and cross-selling customers. However, they are primarily about ARR preservation as opposed to new ARR.
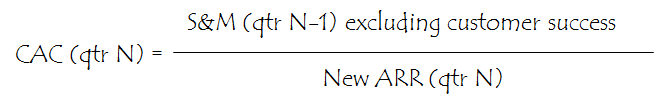
My preferred solution is to exclude both the results from and the cost of the customer success team in calculating the CAC. That is, my definition of the CAC is:

I explicitly exclude the cost customer success in the numerator and exclude the effects of churn in the denominator by looking only at the new ARR added during the quarter. This formula works on the assumption that the customer success team is selling a relatively immaterial amount of new ARR (and that their primary mission instead is ARR preservation). If that is not true, then you will need to exclude both the new ARR from customer success as well as its cost.
I like this formula because it keeps you focused on what the ratio is called: customer acquisition cost. We use revenue instead of gross margin and we exclude the cost of customer success because we are trying to build a ratio to examine one thing: how efficiently do I add new ARR to the bucket? My CAC deliberately says nothing about:
- What happens to the water once S&M pours it in the bucket. A company might be tremendous at acquiring customers, but terrible at keeping them (e.g., offer a poor quality service). If you look at net change in ARR across two periods then you are including both the effects of new sales and churn. That is why I look only at new ARR.
- The profitability of operating the service. A company might be great at acquiring customers but unable to operate its service at a profit. You can see that easily in subscription gross margins and don’t need to embed that in the CAC.
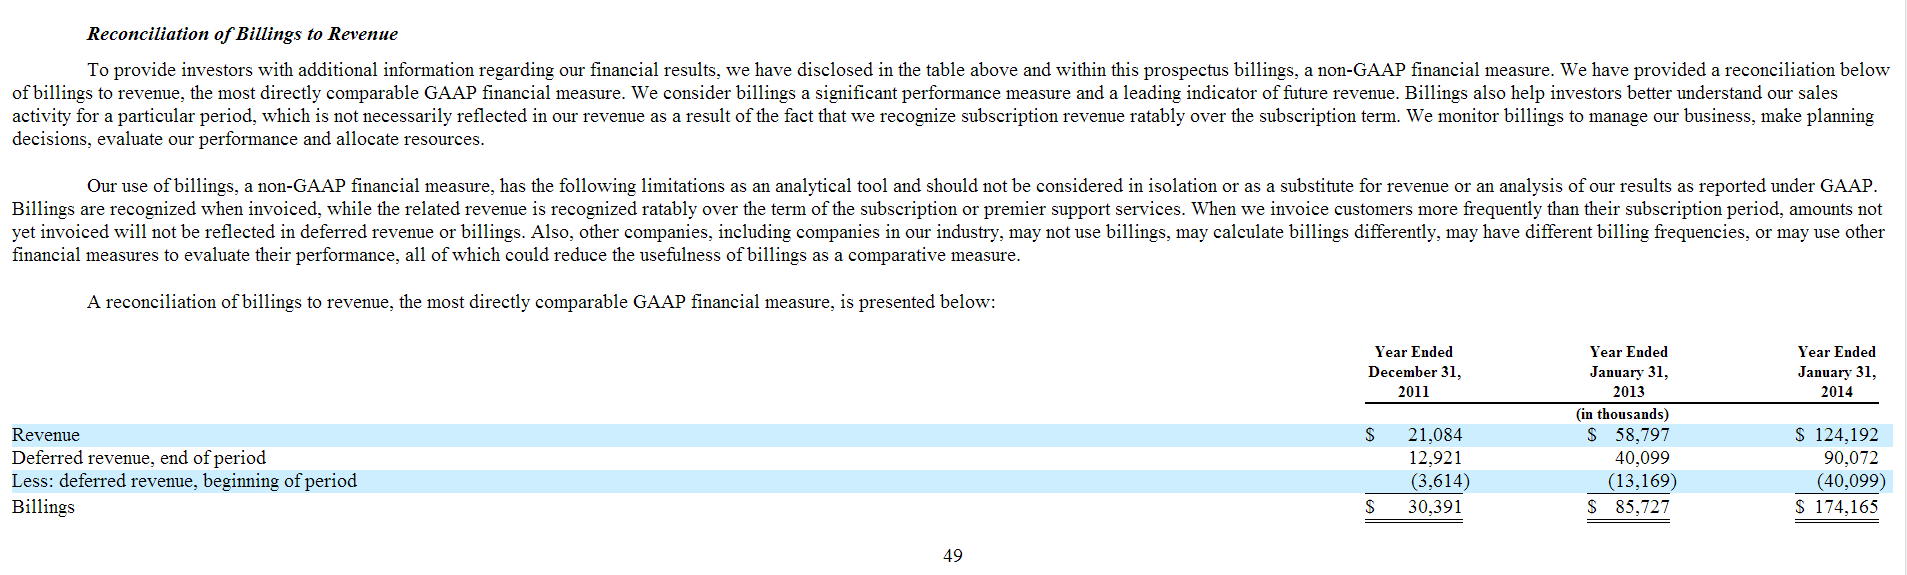
There is a problem, of course. For public companies you will not be able to calculate my CAC because in all likelihood customer success has been included in S&M expense but not broken out and because you can typically only determine the net change in subscription revenues and not the amounts of new ARR and churn. Hence, for public companies, the Magic Number is probably your best metric, but I’d just call it 1/CAC.
My definition is pretty close to that used by Pacific Crest in their annual survey, which uses yet another slightly different definition of the CAC: how much do you spend in S&M for a dollar of annual contract value (ACV) from a new customer?
(Note that many vendors include first-year professional services in their definition of ACV which is why I prefer ARR. Pacific Crest, however, defines ACV so it is equivalent to ARR.)
I think Pacific Crest’s definition has very much the same spirit as my own. I am, by comparison, deliberately simpler (and sloppier) in assuming that customer success not providing a lot of new ARR (which is not to say that a company is not making significant sales to its customer base – but is to say that those opportunities are handed back to the sales function.)
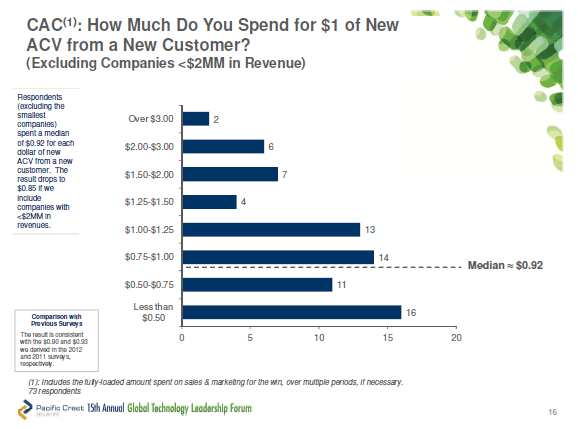
Let’s see the distribution of CAC ratios reported in Pacific Crest’s recent, wonderful survey:

Wow. It seems like a whole lot of math and analysis to come back and say: “the answer is 1.”
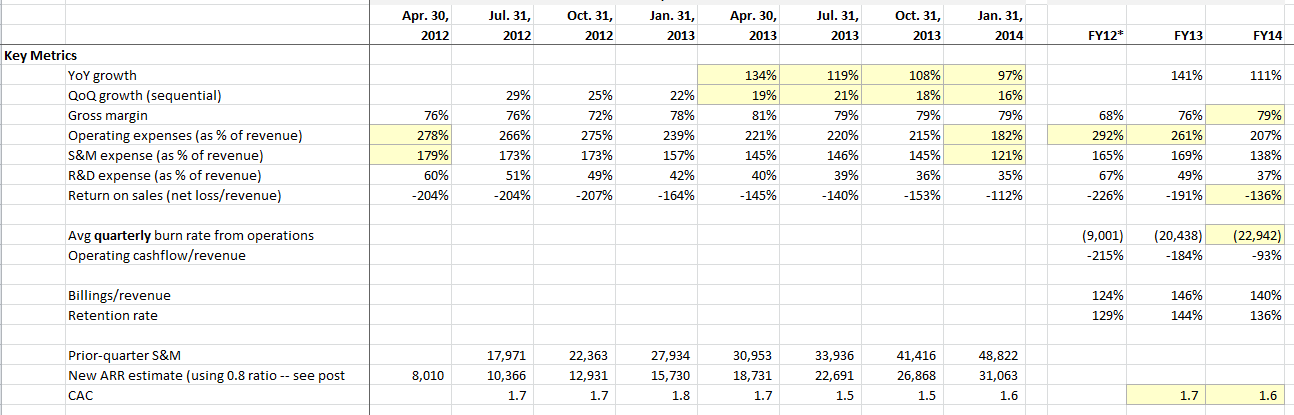
But that’s what it is. A healthy CAC ratio is around 1, which means that a company’s S&M investment in acquiring a new customer is repaid in about a year. Given COGS associated with running the service and a company’s operating expenses, this implies that the company is not making money until at least year 3. This is why higher CACs are undesirable and why SaaS businesses care so much about renewals.
Technically speaking, there is no absolute “right” answer to the CAC question in my mind. Ultimately the amount you spend on anything should be related to what it’s worth, which means we need relate customer acquisition cost to customer lifetime value (LTV).
For example, a company whose typical customer lifetime is 3 years needs to have a CAC well less than 1, whereas a company with a 10 year typical customer lifetime can probably afford a CAC of more than 2. (The NPV of a 10-year subscription increasing price at 3% with a 90% renewal rate and discount at 8% is nearly $7.)
Time Periods of S&M Expense
Let me end by taking a practical position on what could be a huge rat-hole if examined from first principles. The one part of the CAC we’ve not yet challenged is the use of the prior quarter’s sales and marketing expense. That basically assumes a 90-day sales cycle – i.e., that total S&M expense from the prior quarter is what creates ARR in the current quarter. In most enterprise SaaS companies this isn’t true. Customers may engage with a vendor over a period of a year before signing up. Rather than creating some overlapped ramp to try and better model how S&M expense turns into ARR, I generally recommend simply using the prior quarter for two reasons:
- Some blind faith in offsetting errors theory. (e.g., if 10% of this quarter’s S&M won’t benefit us for a year than 10% of a year ago’s spend did the same thing, so unless we are growing very quickly this will sort of cancel out).
- Comparability. Regardless of its fundamental correctness, you will have nothing to compare to if you create your own “more accurate” ramp.
I hope you’ve enjoyed this journey of CAC discovery. Please let me know if you have questions or comments.