Don’t Be Enslaved by Metrics

I love metrics.  I live for metrics.  Every week and every quarter I drown my team in metrics reviews.  Why?  Because metrics are the instrumentation — the flight panel — of our business.   Good metrics provide clear insights.  They cut through politics, spin, and haze.  They spark amazing debates.   They help you understand your business and compare it to others.

I love metrics, but I’ll never be enslaved by them.  Far too often in business I see people who are enslaved by metrics.  Instead of mastering metrics to optimize the business, the metrics become the master and the manager enslaved by them.

I define metrics enslavement as the case when managers stop thinking and work blindly towards achieving a metric regardless of whether they believe doing so leads to what they consider is best for the business.

One great thing about sports analytics is that despite an amazing slew of metrics, everyone remembers it’s the team with the most goals that wins, not the one who took the most shots.  In business, we often get that wrong in both subtle and not-so-subtle ways.

Here are metrics mistakes that often lead to metrics enslavement.

  1. Dysfunctional compensation plans, where managers actively and openly work on what they believe are the wrong priorities in response to a compensation plan that drives them to do so. The more coin-operated the type of people in a department, the more carefully you must define incentives.  While strategic marketers might challenge a poorly aligned compensation plan, most salespeople will simply behave exactly as dictated by the compensation plan.  Be careful what you ask for, because you will often get it.
  1. Poor metric selection. Marketers who count leads instead of opportunities are counting shots instead of goals.  I can’t stand to see tradeshow teams giving away valuable items so they can run the card of every passing attendee.  They might feel great about getting 500 leads by the end of the day, but if 200 are people who will never buy, then they are not only useless but actually have negative value because the company’s nurture machine is going to invest fruitless effort in converting them.
  1. Lack of leading indicators. Most managers are more comfortable with solid lagging indicators than they are with squishier leading indicators.  For example, you might argue that leads are a great leading indicator of sales, and you’d be right to the extent that they are good leads.  This then requires you to define “good,” which is typically done using some ABC-style scoring system.  But because the scoring system is complex, subjective, and requires iteration and regression to define, some managers find the whole thing too squishy and say “let’s just count leads.” That’s the equivalent of counting shots, including shots off-goal that never could have scored.  While leading indicators require a great deal of thought to get right, you must include them in your key metrics, lest you create a company of backwards-looking managers.
  1. Poorly-defined metrics. The plus/minus metric in hockey is one of my favorite sports metrics because it measures teamwork, something I’d argue is pretty hard to measure [1].  However, there is a known problem with the plus/minus rating.  It includes time spent on power plays [2] and penalty kills [3].  Among other problems, this unfairly penalizes defenders on the penalty-killing unit, diluting the value of the metric.  Yet, far as I know, no one has fixed this problem.   So while it’s tracked, people don’t take it too seriously because of its known limitations.  Do you have metrics like this at your company?  If so, fix them.
  1. Self-fulfilling metrics. These are potential leading metrics where management losses sight of the point and accidentally makes their value a self-fulfilling prophecy.  Pipeline coverage (value of oppties in the pipeline / plan) is such a metric.  Long ago, it was good leading indicator of plan attainment, but over the past decade literally every sales organization I know has institutionalized beating salespeople unless they have 3x coverage.  What’s happened?  Today, everyone has 3x coverage. It just doesn’t mean anything anymore.  See this post for a long rant on this topic.
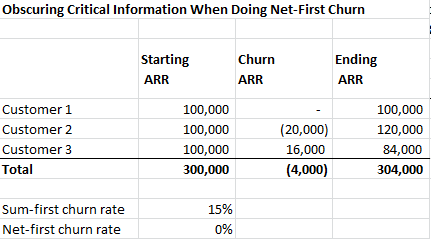
  1. Ill-defined metrics, which happen a lot in benchmarking where we try to compare, for example, our churn rate to an industry average. If you are going to make such comparisons, you must begin with clear definitions or else you are simply counting angels on pinheads.   See this post where I give an example where, off the same data, I can calculate a renewals rate of 69%, 80%, 100%, 103%, 120%, 208%, or 310%, depending on how you choose to calculate.  If you want to do a meaningful benchmark, you better be comparing the 80% to the 80%, not the 208%.
  1. Blind benchmarking. The strategic mistake that managers make in benchmarking is that they try to converge blindly to the industry average.  This reminds me of the Vonnegut short-story where ballerinas have to wear sash-weights and the intelligentsia have music blasted into their ears in order to make everyone equal.  Benchmarks should be tools of understanding, not instruments of oppression.   In addition, remember that benchmarks definitionally blend industry participants with different strategies.  One company may heavily invest in R&D in product-leadership strategy.  One may heavily invest in S&M as part of market-share leadership strategy.  A third may invest heavily in supply chain optimization as part of cost-leadership strategy.  Aspiring to the average of these companies is a recipe for failure, not success, as you will end up in a strategic No Man’s Land.  In my opinion, this is the most dangerous form of metrics enslavement because it happens at the boardroom level, and often with little debate.
  1. Conflicting metrics. Let’s take a concrete example here.  Imagine you are running a SaaS business that’s in a turnaround.  This year bookings growth was flat.  Next year you want to grow bookings 100%.  In addition, you want to converge your P&L over time to an industry average of S&M expenses at 50% of revenues, whereas today you are running at 90%.  While that may sound reasonable it’s actually a mathematical impossibility.   Why?  Because the company is changing trajectories and in a SaaS business revenues lag bookings by a year.   So next year revenue will be growing slowly [4] and that means you need to grow S&M even slower if you want to meet the P&L convergence goal.  But if you want to meet the 100% bookings growth goal, with improving efficiency, you’ll need to increase S&M cost by say 70%.  It’s impossible.  #QED.  There will always be a tendency to split the difference in such scenarios but that is a mistake.  The question is which is the better metric off which to anchor?   The answer, in a SaaS business is bookings.  Ergo, the correct answer is not to split the difference (which will put the bookings goal at risk) but to recognize that bookings is the better metric and anchor S&M expense to bookings growth.  This requires a deep understanding of the metrics you use and the courage to confront two conflicting rules of conventional wisdom in so doing.

In the end, metrics enslavement, while all too common, is more about the people than the metrics.  Managers need to be challenged to understand metrics.  Managers need to be empowered to define new and better metrics.  Managers must to be told to use their brains at all times and never do something simply to move a metric.

If you’re always thinking critically, you’ll never be enslaved by metrics.  The day you stop, you will.

# # #

[1] The way it works is simple:  if you’re on the ice when your team scores, you get +1.  If you’re on the ice when the opponent scores you get -1.  When you look at someone’s plus/minus rating over time, you can see, for example, which forwards hustle back on defense and which don’t.

[2] When, thanks to an opponent’s penalty you have more players on the ice then they do.

[3] When, thanks to your team’s penalty, your opponent has more players on the ice than you do.

[4] Because bookings grew slowly this year

Churn:  Net-First or Sum-First?

****

Please note that this post has been superseded by A Fresh Look at How to Measure SaaS Churn Rates.  I’m leaving it posted to protect in-bound links only and to provide a referral to my latest material on this subject. 

****


While I’ve already done a comprehensive post on the subject of churn in SaaS companies and some perils in how companies analyze it, in talking with fellow SaaS metrics lovers of late, I’ve discovered a new problem that isn’t addressed by my posts.

The question?   When calculating churn, should you sum first (adding up all the shrinkage ARR) or net first (net shrinkage vs. expansion ARR and then sum that).  It seems like a simple question, but like so many subtitles in SaaS metrics, whether you net-first or sum-first, and how you report in so doing, can make a big difference in how you see the business through the numbers.

Let’s see an example.

net1

So what’s our churn rate:  a healthy -1% or a scary 15%?  The answer is both.  In my other post, I define about 5 churn rates, and when you sum first you get my “net ARR churn” rate [1], which comes in at a rather disturbing 15%.  When, however, you net first you end up a healthy -1% (“gross ARR churn”) rate because expansion ARR has more than offset shrinkage.  At my company we track both rates because each tells you a different story.

Thanks to the wonders of math, both the net-first and sum-first calculations take you to the same ending ARR number.  That’s not the problem.

The problem is that many companies report churn in a format not like my table above, but in something simpler like that looks like this below [2].

net2

As you can see, this net-first format doesn’t show expansion and shrinkage by customer.  I think this is dangerous because it can obscure real problems when shrinkage ARR is offset, or more than offset, by expansion ARR.

For example, customer 2 looks great in the second chart (“wow, $20K in negative churn!”).  In the first chart, however, you can see customer dropped 4 seats of product A and more than offset that by buying 8 seats of product B.  In fact, in the first chart, you can see that everyone is dropping product A and buying product B which is hidden in the second chart that neither breaks out shrinkage from expansion nor provides a comment as to what’s going on.  My advice is simple:  do sum-first churn and report both the “net ARR” and “gross ARR” renewal rates and you’ll get the whole picture.

Aside 1:  The Reclaimed ARR Issue
This debate prompted a second one with my Customers For Life (CFL) team who wanted to introduce a new metric called “reclaimed ARR,” the ARR that would have been lost on renewal but was saved by CFL through cross-sells, up-sells, and price increases.  Thus far, I’m not in love with the concept as it adds complexity, but I understand why they like it and you can see how I’d calculate it below.

net3

Aside 2:  Saved ARR
The first aside was prompted by the fact that CFL/renewals teams primarily play defense, not offense.  Like goalies on a hockey team, they get measured by a negative metric (i.e., the churn ARR that got away).   Even when they deliver offsetting expansion ARR, there is still some ARR that gets away, and a lot of their work (in the customer support and customer success parts of CFL) is not about offsetting-upsell, it’s about protecting the core of the renewal.  For that reason, so as to reflect that important work in our metrics, we’ve taken a lesson from baseball and the notion of a “save.”  Once the renewals come in, we add up all the ARR that came from customers who were, at any point in time since their last renewal, in our escalated accounts program and call that Saved ARR.    It’s best metric we’ve found thus far to reflect that important work.

# # #

[1] I have backed into the rather unfortunate position of using the word “net” in two different ways.  When I say “net ARR churn” I mean churn ARR net of (i.e., exclusive of) expansion ARR.  When I say net-first churn, I meant to net-out shrinkage vs. expansion first, before summing the customers to get total churn.

[2] Note that I properly inverted the sign because negative churn is good and positive churn is bad.

Make a Plan That You Can Beat

Seven words that changed the world:  “make a plan that you can beat.”

This pithy piece of wisdom was first passed onto me by the sage of Sequoia Capital, Mike Moritz, on the first day of my six-year journey at MarkLogic, during which time we grew the company from effectively zero to $80M.  Thanks to Mike’s advice, we made plan in about 90% of those 24 quarters.

What’s so important about making a plan that you can beat?

  • For starters, it helps keep you employed. Few CEOs get axed when they are making plan.  (It can be done, but takes real skill at board alienation.)
  • It forces you to make a balanced plan: sufficiently realistic and sufficiently aggressive.  (“Can beat” means neither “will certainly beat” nor “can achieve if a miracle occurs.”)
  • It means you can predictably manage your cash – the oxygen of any startup. As another quotable Sequoia partner, Don Valentine, used to say:  “all companies go out of business for the same reason; they run out of money.”
  • It forces you to debate important issues up front. To the extent the board wants 80% growth next year and you believe that you can only deliver 30%, it is far better to have that uncomfortable conversation during the planning process in November (while you are still achieving this year’s plan) than in July, after you’ve missed Q1 and Q2.   (In July, the uncomfortable conversation is more likely to be about your severance package than the aggressiveness of the approved plan.)
  • It says that you are in control of your business. Whether or not the board loves the plan the eventually approve, the first step in running any business is to be in control of it.  That means being able to predict with reasonable accuracy the results you can achieve.
  • It reduces the tendency to sign up for too much bookings/revenue to “get” more expense. Often managers somewhat arbitrarily decide what expenses they need to be successful, anchor emotionally to that number, and then get “talked up” on the bookings/revenue side in order to hit a given cash flow or EBITDA goal.  This is exactly backwards.  You should put a huge amount of energy into your bookings/revenue plan and work from that to set expense targets.  If you can’t find a workable solution, then argue you have the wrong EBITDA or cashflow goal.  Don’t get talked up on revenue because it’s unpleasant to ask your passionate and anchor-biased managers to cut expenses.
  • It is philosophically aligned with most executive compensation plans. Most boards like gated compensation plans where, for example, executives get 0% of their target bonus up to 80% of plan performance (the “gate”), payout 50% of target at 80% of plan, go linearly to 100% payout at 100% of plan, and then have accelerators beyond that.  These plans reward above-plan performance and severely punish below-plan performance.  As such, any executive who looks at his/her compensation plan should understand the not-so-subtle message it sends:  beat plan [1] (which is, of course, most easily achieved by making a plan that you can beat).
  • You can always speed up later. If you’re ahead of plan after Q1 and your leading indicators look solid for Q2, no board on Earth will not approve a revision to the plan that accelerates growth.   Think of your plan growth rate not as what you aspire to achieve, but rather as what you are willing to be fired for not achieving.  It takes real skill to grow a company at 100% and get fired for missing plan, but I’ve seen that done, too [2].

Some of you may be thinking:  isn’t this all a fancy of way of saying “sandbag” [3].  I think not.  Even if you reject every other argument above, you cannot deny that cash is oxygen to startups, that startups that run out of cash get crushed by dilution when they need to raise money when running on fumes, and thus making a plan that you can beat is critical to managing cash, and indirectly, to the eventual value of company’s common stock.

Make a plan that you can beat.  Seven words to understand.  Seven words to internalize.  Seven words to live by.

 # # #

Footnotes

[1] Whether boards should like this style of compensation plan is debatable because they arguably do not incent risk-taking.  That debate aside, the fact remains that most board do like this style of plan so managers should listen to the message that is very clearly sent.

[2] The real way to know if 100% is good enough should be to look at the market.  If you’re gaining share when growing 100% but missing plan of 120% then in my book you are planning poorly, but executing well.  However, if you are losing share when growing at 100%, you are in a hot market but not executing aggressively enough to win it.  Performance measures should always be normalized to the market, otherwise target-setting and plan-performance ratings are more about negotiating skills than actual performance in the market.  (I’ve seen this one done wrong many times, too.)

[3] Aside:  I believe there are two different types of sandbagging:  (1) consistently under-forecasting – i.e., landing at a result significantly higher than you forecast early in the quarter, and (2) consistently overachieving plan – i.e., landing well above operating plan targets.  Type 1 is bad because it leads to either to needlessly cutting quarterly expenses in response to a weak early-quarter forecast (if you believe it) or simply ignoring the forecast (if you don’t) – in which case what good is it?  Type 2 means either the company is performing tremendously or they are too good at negotiating targets.  Looking at whether you’re gaining or losing market share (or grabbing a greenfield opportunity fast enough) will tell you which.

Why I’m Against Succession Planning at Startups

I have to admit I’m not a fan of succession planning in general, at startups in particular, and especially when the successee is involved in the process. Why? Because the process quickly ends up presumptuous and political.

In my experience, the successee is more concerned with being a “good guy” on the way out than with what’s best for the business. Consider the retiring CFO of a $500M company. Eighteen months before he wants to retire, he starts succession planning, picks his favorite division-level finance chief, anoints her the chosen one, and starts the grooming process (“one day all this will be yours”). The chosen one starts showing at meetings to which she’s not usually invited, and demonstrates some new swagger with peers.

The CFO eventually retires and the CEO and board replace him not with the chosen one, but with an experienced CFO coming from a $2B company. Feelings are hurt, strong performers are demotivated, and hub-bub generated — all for nothing. The chosen one didn’t even make the first cut of requirements in the job spec. The retiring CFO didn’t (and shouldn’t) get a vote.

The thing to remember with startups (and high-growth companies in general) is that you don’t want to hire the person you need now; you want to hire the person you need three years from now. And the odds that the person you need three years from now is working for the current boss today are pretty low. Put differently (and most certainly when going outside for a hire), the job should grow into the person; the person shouldn’t grow into the job.

The default succession plan for almost any startup executive – including the CEO – is therefore to go hire someone from outside who’s overqualified for the current job. If you wonder why someone overqualified would take the job … well, that’s why the Gods created stock options.

Before you think I’m an anti-career-development cretin, this is not to say that companies should always go outside to backfill key roles. Sometimes people are able to grow within fast-growing organizations. I myself did this as I rose from technical support engineer to director of product marketing over 7 years at a company that grew from $30M to $240M along the way. So I’m all in favor of it; it just doesn’t happen very often. And more often than not, managers who consistently only want to promote from within are actually saying they’re afraid to go outside and find strong direct reports who will challenge them. Remember, I’m talking about patterns and rules here; there will always be exceptions.

The reality is in high-growth startups, just “holding on” to your current management or executive job is both hard enough and a big growth opportunity. Running product management, sales, or HR at $10M is quite different from running it at $300M. During my tenure at Business Objects, as we grew from $30M to over $1B in revenues, only one other team member and myself “held on” during that growth. Out of about 15-20 people that made up the broadly defined leadership team, every other person got replaced, sometimes two or three times, along the way.

That’s why I think succession planning – making plans for how to replace Jane when Jane is healthy, happy, and doing a great job for the company – is a waste of time. Let’s keep Jane focused on growing the business, which is hard enough. If she gets hit by the proverbial bus, well, let’s just deal with that when it happens. We pretty much know what we’re going to do anyway (i.e., call a recruiter).

The best argument against my viewpoint is the case we’ll call Marty. Let’s say Marty would be a great candidate for the CFO job. He’s a great controller, has great leadership skills, and strong business sense — but hasn’t spent much time in FP&A. After Jane gets hit by the bus, we might think “darn, Marty would have been great if we’d moved him into FP&A last year to develop him.”

My two-part response to this is:

  • Yes, sometimes it makes sense and if Marty’s got his act together he’ll be pushing for the FP&A job if it opens up along the way — best developing himself and positioning himself for any eventual CFO opportunity. Since there is always risk associated with any outside hire, Marty should pitch that the risks associated with him learning the job are less than those associated with taking a new person into the organization.
  •  The decision whether to give Marty the job will come down to how fast the company’s growing and whether the company is better off with a talented-but-rookie FP&A head, an internally promoted FP&A manager, or a veteran outsider. Yes, we want to help develop Marty, but if the company’s growing super-fast, then just “hanging on” should provide plenty of development and financial benefit (i.e., stock option appreciation) for him along the way.

Some would note that if we turn down Marty for the FP&A job, he may quit because he feels he has no opportunity for career growth. I understand; I quit a job myself once for that very reason. But I did so in an environment where company growth had stalled and I wasn’t going to get either financial reward or career development for sticking around. If the company is growing fast, then Marty will get both. If it’s not, most of the principles I describe here don’t apply because this post is about succession planning at startups and high-growth companies.

In fact, succession planning makes a lot of sense at low-growth companies, where the organization is static and people move through it. If you want to retain your people over time, you better think about those career paths, and rotate your Marty’s through FP&A to keep them having fun and learning. And, in those environments, the best person to take over for the retiring CFO might well be one of his/her direct reports (and dangling that opportunity might well help retain a few of them along the way).

The real problem is when big company types come to a high-growth company and say “let’s do succession planning (because we did it at my last company and it’s just something that one does)” – and nobody asks why.

Most of the time, in a high-growth startup, it won’t make sense. Or, if you make a succession plan, it will simply be 1-800-HEIDRICK, 1-800-DAVERSA, or 1-800-SCHWEICHLER.

Average Contract Duration and SaaS Renewals: All Is Not As It Appears

Chatting with some SaaS buddies the other day, we ran into a fun — and fairly subtle — SaaS metrics question.  It went something like this:

VP of Customer Success:  “Our average contract duration (ACD) on renewals was 1.5 years last quarter and –”

VP of Sales:  “– Wait a minute, our ACD on new business is 2.0 years.  If customers are renewing for shorter terms than those of the initial sale, it  means they are less confident about future usage at renewals time than they are at the initial purchase. Holy Moly, that means we have a major problem with the product or with our customer success program.”

Or do we?  At first blush, the argument makes perfect sense.  If new customers sign two-year contracts and renewing ones sign 1.5-year contracts, it would seem to indicate that renewing customers are indeed less bullish on future usage than existing ones.  Having drawn that conclusion, you are instantly tempted to blame the product, the customer success team, technical support, or some other factor for the customers’ confidence reduction.

But is there a confidence reduction?  What does it actually mean when your renewals ACD is less than your new business ACD?

The short answer is no.  We’re seeing what I call the “why are there so many frequent flyers on airplanes” effect.  At first blush, you’d think that if ultra-frequent flyers (e.g., United 1K) represent the top 1%, then a 300-person flight might have three or four on board, while in reality it’s more like 20-30.  But that’s it — frequent flyers are over-represented on airplanes because they fly more; just like one-year contracts are over-represented in renewals because they renew more.

Let’s look at an example.  We have a company that signs one-year, two-year, and three-year deals.  Let’s assume customers renew for the same duration as their initial contract — so there is no actual confidence reduction in play.  Every deal is $100K in annual recurring revenue (ARR).  We’ll calculate ACD on an ARR-weighted basis.  Let’s assume zero churn.

If we sign five one-year, ten two-year, and fifteen three-year deals, we end up with $3M in new ARR and an ACD of 2.3 years.

renewals and acd

In year 1, only the one-year deals come up for renewal (and since we’ve assumed everyone renews for the same length as their initial term), we have an ACD of one year.  The VP of Sales is probably panicking — “OMG, customers have cut their ACD from 2.3 to 1.0 years!  Who’s to blame?  What’s gone wrong?!”

Nothing.  Only the one-year contracts had a shot at renewing and they all renewed for one year.

In year 2, both the (re-renewing) one-year and the (initially renewing) two-year contracts come up for renewal.  The ACD is 1.7 — again lower than the 2.3-year new business ACD.  While, again, the decrease in ACD might lead you to suspect a problem, there is nothing wrong.  It’s just math and the fact that the shorter-duration contracts renew more often which pulls down the renewals ACD.

What To Do About This?
First, understand it.  As with many SaaS metrics, it’s counter-intuitive.

As I’ve mentioned before, SaaS metrics and unit economics are often misunderstood.  While I remain a huge fan of using them to run the business, I strongly recommend taking the time to develop a deep understanding of them.  In addition, the more I see counter-intuitive examples, the more I believe in building full three- to five-year financial models of SaaS businesses in order to correctly see the complex interplay among drivers.

For example, if a company does one-year, two-year, and three-year deals, a good financial model should have drivers for both new business contract duration (i.e., percent of 1Y, 2Y, and 3Y deals) and a renewals duration matrix that has renewals rates for all nine combinations of {1Y, 2Y, 3Y} x (1Y, 2Y, 3Y} deals (e.g., a 3Y to 1Y renewal rate).  This will produce an overall renewals rate and an overall ACD for renewals.  (In a really good model, both the new business breakdown and the renewals matrix should vary by year.)

Armed with that model, built with assumptions based on both history and future goals for the new business breakdown and the renewals matrix, you can then have meaningful conversations how ACD is varying on new and renewals business relative to plan.  Without that, by just looking at one number and not understanding how it’s produced, you run the very real risk of reacting to math effects setting off a false alarm on renewals.