Kellblog covers topics related to starting, leading, and scaling enterprise software startups including company strategy, financing strategy, go-to-market strategy, sales, marketing, positioning, messaging, and metrics
We ended up not duplicating Car Talk’s radio call-in format, and unlike many podcasts, we’ve also chosen not to center the podcast around guest interviews. Instead, we talk — some might say bicker — for about 20 minutes roughly every week about SaaS metrics, benchmarks, and reports. We are the perfect treadmill companions.
Because these topics can be, well — kind of dry — we try to have some fun with the podcast, squeezing in the odd bad (and some would say, “dad”) joke and generally trying to seize any opportunity to lighten up the content. One example is our legal trailer which not only covers important legal terms, but does so in a light-hearted way. (Then again, we rarely get feedback on the jokes, so I wonder if people aren’t listening to the trailer. It couldn’t possibly be that the jokes don’t land.)
So in the spirit of fun, we decided to do some Car Talk-style credits to celebrate our 50th episode. Here they are. While the first three rows are real, the rest are Car Talk-style. You can listen to the credits at the end of the episode.
Back in 2018, Rory O’Driscoll, a VC at Scale and the inventor of the SaaS magic number, came up with another important SaaS concept: the Mendoza line for SaaS growth. Taking an idea from baseball, the Mendoza line is a measure of “offensive futility” named after Mario Mendoza, one of the best defensive shortstops in baseball, who unfortunately was challenged as a hitter, constantly struggling to maintain a .200 batting average. The question considered by the Mendoza line is: how low a batting average can a player have and remain in Major League Baseball, even with a very high level of defensive talent? The answer, in Mendoza’s day, was around .200. Above that, they’d keep you on the team for your defensive abilities; below that, they’d probably send you down to the minor leagues [1].
Driscoll translated this concept to SaaS, creating a line that provides, across a range of ARR sizes, a growth rate below which a company is not on a venture-backable trajectory. In short, if you’re above the SaaS Mendoza line, VCs will want to invest in your company, and if you’re not, they won’t. So it’s an important concept and one that helps answer a very difficult question for founders: how fast should we be growing?
Here’s the Mendoza line from Rory’s original post:
Note that the Mendoza line is a growth trajectory rule and thus should be considered along with other growth trajectory rules and metrics like T2D3 (triple, triple, double, double, double) by Battery’s Neeraj Agrawal, the growth endurance observations periodically discussed by Janelle Teng of Bessemer, or my Rule of 56789 published with my then-colleague at Balderton, Michael Lavner.
The inspiration for today’s post was a recent update to the SaaS Mendoza line published by Scale’s Eduard Danalache in July. Since the line changed with this update, I’ll refer to the original as the 2018 Mendoza line and the new one as the 2024 Mendoza line.
Now, let’s dive in.
The Two Assertions Behind the 2018 Mendoza Line
O’Driscoll said the Mendoza line was based on two assertions (paraphrased):
That most venture investors prefer to invest in companies with a chance to become standalone public companies. Looking at the (then-)realistic low bar of what that takes, this implied ARR of $100MM at the time of IPO, while still growing at 25% or greater.
That, most of the time, growth rates decline in a way that is fairly predictable. For a best-in-class SaaS company, the growth rate for any given year is between 80% and 85% of the growth rate of the prior year. Scale refers to this as growth persistence and argues this assumption holds true from about $10M on.
Some quick comments:
My how times have changed. Last week, I heard OneStream, at nearly $500M in ARR, referred to as “on the small side” for an IPO today [2]. That’s five times bigger than Rory’s bar, set only six years ago. Since a viable path to IPO is inherent in the definition of the SaaS Mendoza Line, the math needs to be updated to account for this.
What Scales calls “growth persistence” is now commonly called growth endurance. I’ll use the latter term henceforth.
There were some objections to the Mendoza line when it was introduced and Scale responded to them with a follow-up post. It’s a good read, but I won’t dig into it here. The headline news is simple: somebody needs to update the math.
The first thing they did was change the IPO criteria:
For the sake of this analysis, we’ll use a more ambitious target of $250M ARR growing at 25%, with a clear path to profitability. Again, don’t take this as gospel truth for when to IPO, but for the math to work we have to draw a line in the sand to aim for, and we believe this is a fair target in today’s world.
While this raises the bar significantly, I think it’s still too low. Anecdotally, per some recent Meritech S-1 breakdowns:
OneStream just went public with ARR of $480M growing at 34%
Rubrik went public earlier this year with $784M of ARR, growing at 47%
Klavyio went public in 2023 with $658M of implied ARR, growing at 51%
The last Meritech breakdown that resembles their target is Hashicorp, which went public in 2021 with $294M of ARR but was growing at 50%. But that stock, after some initial highs, was basically a dud in the public markets, so it’s perhaps not the ideal case study.
If I had to guess, I’d say the IPO bar today for software companies is more like $400M growing at 40% than $250M growing at 25% [3]. Many, me among them, would argue that the bar is much higher than it needs to be, but there are things we can’t control and this is certainly one of them.
Once you pick the destination (in terms of size and growth rate) and the growth endurance factor (Scale picks 85%), the rest is just a math problem.
But with one catch. Where do you start? The 2018 Mendoza line chart goes all the way down to $1M in ARR [4]. In the 2024 version, they basically say we don’t care how you get to $10M, but once you get there the Mendoza line takes effect.
Here’s the chart they published that compares the 2018 and 2024 Mendoza lines.
And here’s me backing into a curve based on the targets for ending ARR, growth rate, and growth endurance [5].
Running this model forward is all just about powers of 0.85. You pick a starting size, growth rate, and GE factor. You then use the GE factor (85%) to shrink the growth rate every year. So, for example, after 3 years your growth rate 0.85^3 = 61% of what it started at.
The problem with powers of 0.85 is they don’t scale very well. Scale realized this in scaling down, hence the 2024 advice to apply the rule only at $10M+. But, by picking the $250M ending target, they also avoided a degree of scaling up, pushing the rule to the edge of where it stops working because after about 10 years the growth rates it produces are too low. For example, the year 11 the growth rate is only one-fifth of what it was at the “start” [6].
So I’d say the 2024 Mendoza line is decent, but it doesn’t scale infinitely and is best used within a range, starting at $10M and for about the next 10 years.
Comparison to Other Growth Trajectory Rules and Metrics
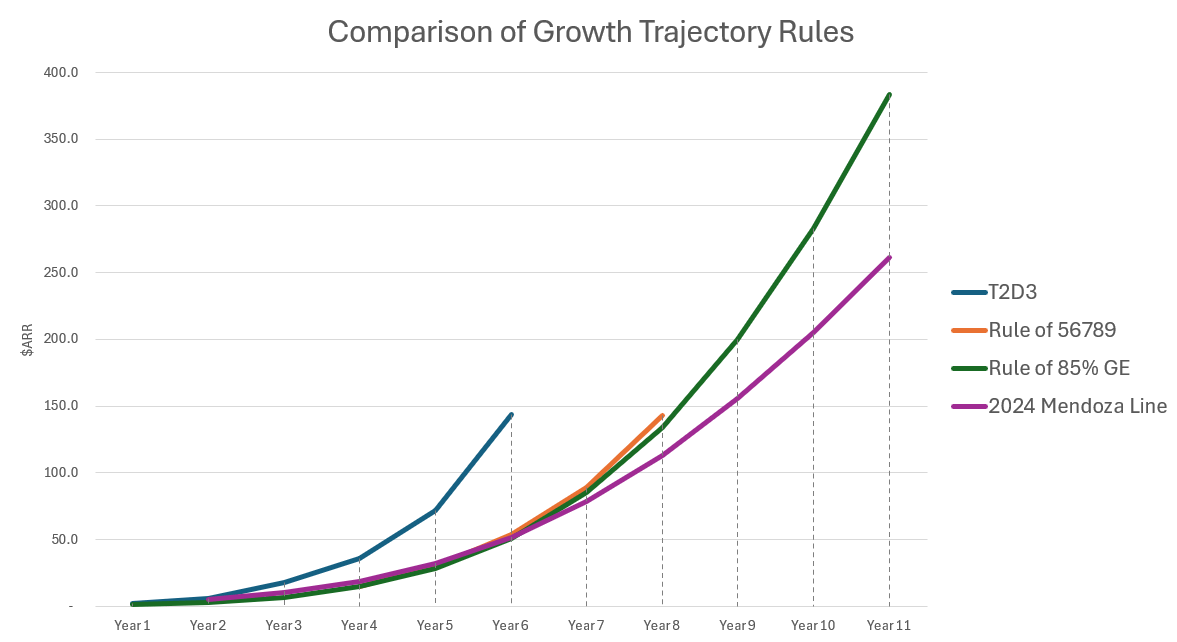
Let’s conclude by comparing the Mendoza line to other rules and metrics for thinking about startup growth trajectory. Namely:
T2D3, which says once a company hits $2M in ARR it should seek to triple twice and then double three times.
The Rule of 56789, which says that startups should seek to break $10M in 5 years, $20M in 6 years, $50M in 7 years, $75M in 8 years, and $100M in 9 years [7].
The 85% growth endurance rule, which says you should pass $1M at some very high growth rate, then retain 85% of that growth every subsequent year [8]. I only now realize this is essentially a Mendoza line rose by any other name — which highlights a disadvantage of using catchy names (e.g., magic number, Mendoza line) over descriptive ones [9].
Here’s a tabular comparison of these rules [10]:
The outlier is T2D3 which I suspect has some lingering ZIRP growth-at-all-costs logic built in. The other rules tend to generate similar trajectories, none of which (by the way) get you to an IPO in 12 years. This is consistent with what I’m guessing is today’s median of around 14 years to IPO. More than ever, building a startup from inception to IPO is a marathon, not a sprint. Spend your energy accordingly.
Finally, for those who prefer charts, here is a visual comparison of those trajectories.
In this post, we’ve examined the 2024 Mendoza line for SaaS and learned a few things in the process:
That the 2018 Mendoza line is hopelessly out of date given the market changes in IPO requirements. This might explain why it never became as popular as other Scale creations like the magic number.
That since top VCs want to invest in companies that have a shot of going public, that founders should keep an eye on growth trajectories and the outcomes to which they lead. Specifically, if you’re clearly on a trajectory that cannot lead to an IPO, maybe should raise money through PE, regional and/or lower-tier VCs with lesser ambitions, venture debt, or revenue-based financing.
That the Mendoza line is a fancy way of saying retain 85% of your growth each year and (in the 2024 version) that you should start applying it after $10M. Personally, I’ll just use the 85% growth endurance rule as I think it’s simpler and comes without the somewhat arbitrary provisos.
That these rules only work within certain zones. T2D3 works from $2M to $144M and is undefined after that. The 2024 Mendoza line works from $10M to $250M, but beyond that produces growth figures that are too low. The 85% growth endurance rule works across the broadest range, but relies on starting at small size with an amazing growth rate from which to decay.
That rules reflect the environment in which they were created. The 2018 Mendoza line took you to $100M, which was Scale’s assumed IPO bar in 2018 [11]. T2D3 has an in-built high-growth bias reflective of the ZIRP era and best applied today only in greenfield markets where you have lots of capital available (e.g., AI).
That God did not decree that growth needs to decay every year. While this is certainly a common pattern, I have run startups where we accelerated growth (i.e., GE of >100%) and the average growth rate in Meritech’s public comparables is 19% today, higher than the age-driven growth rates which the Mendoza line would imply [12].
Thanks for reading. The spreadsheet I used in making this post is here.
# # #
Notes
[1] Fans will be happy to know that Mendoza ended his career with a .215 batting average. The lowest hitting shortstop today is batting .219.
[2] To really blow your mind, back at Business Objects, we went public in 1994 off $30M in revenues, which was fairly normal at the time. The IPO bar has gone way, way up over the decades and changed many things in Silicon Valley as a result. For example, creating the entire asset class of VC/PE growth equity which was unnecessary when companies went public with a $100M round off $30M in revenues.
[3] The IPO bar is ever-changing, somewhat ill-defined, and not something you can easily get data on unless you’re friendly with a bunch of investment bankers. For more data, go here, here, and here.
[4] Which is odd because the text of the article says the growth endurance behavior doesn’t start until $10M. I suspect the comment was added after the initial posting and the spreadsheets weren’t changed.
[5] Note that Mendoza line is presented as a curve which makes me think they calculated the equation for this curve and then plugged in the nice neat 10, 20, 30, etc. ARR sizes along the bottom. See my spreadsheet where I do that using an Excel trendline and accompanying formula.
[6] That is, your growth rate in the year in which you passed $10M.
[7] Reminder: this is about a trajectory and break means break, not hit. Some people misread the rule by translating the thresholds to growth rates which is not correct. By the way, those figures were arrived at by seeing what it took to be top quartile in the Balderton universe of data.
[8] I called it Growth Retention Rule in the 56789 blog post but don’t like how that abbreviates to GRR, so I switched to Growth Endurance here both to use today’s more commonplace language and avoid ambiguity around GRR (which means gross retention rate to most).
[9] It maps pretty well to the 2018 Mendoza line, though today’s now starts at $10M per Scale.
[10] Where the second and third rows are not the only possible trajectories, but each an example of a reasonable rule-compliant trajectory.
[11] I still think that was a low-ball estimate even in 2018.
[12] Though, in defense of Scale, they argue the Mendoza line is a tool for determining if you’re on an IPO trajectory and it was not designed to work beyond the IPO timeframe.
So, you’re missing plan and revenue growth is down. Well, welcome to the club. You’re certainly not alone in these times.
In this post, I’ll discuss what you can do about it – specifically, how you can apply some of the ideas I’ve discussed in Kellblog to troubleshoot go-to-market (GTM) performance. I’ll focus on troubleshooting new business (“newbiz”) ARR plan attainment, the area where most companies seem to be having the most trouble [1].
Don’t Knee-Jerk Blame the Plan
The immediate temptation when missing plan is to blame the plan. “It’s not realistic.” “It was driven by the fundraise, not the bottom-up.” But blaming plan is a poor place to start for two reasons.
First, you signed up for the plan when you submitted it to the board for approval. Next time, if you don’t believe in a proposed plan, don’t be so quick to fold in the face of internal pressure. Remember the old Fram oil filter commercial and think, “you can fire me now or fire me later” so if you’re asking me to sign up for a plan that I don’t think I can achieve, you might as well fire me now [2]. The need to make such difficult judgments is the price of admission to the sales leadership role. Cop out at your own peril, because they will indeed fire you later.
Second, when you follow the approach in this post, if the plan is unachievable it will emerge from the data. So, bite your tongue, avoid any initial temptation to blame plan, and instead go look at the funnel.
The Two Questions and Two Metrics
Recall in this post, I argued that you should ask two questions when you’re missing plan. Every quarter:
Are we giving sales the chance to hit the number?
Is sales converting enough of the pipeline to hit the number?
That’s it. Everything comes down to these two questions. No matter the root problem, it will be revealed in answering them. Remember, the way to make plan for twelve consecutive quarters is one at a time. So why not focus on next quarter? And if you’re chronically missing plan, why not make a steady-state assumption to simplify things further? [3]
Starting with the above two questions makes things simple by breaking the entire funnel in two. Simplifying the problem is important because you can quickly and irrecoverably descend into analytical quicksand. When I first meet them, many companies are neck-deep in such quicksand, comparing dashboard clips, reports, and spreadsheets derived from different systems, lost in an endless sea of non-footing detail, having completely lost the business forest for the salesops trees.
Note that neither of the two above questions assigns blame. As a consultant, I have the distinct advantage of not caring where the trouble is, making me a disinterested party, de facto impartial. I encourage CXOs to adopt a similar approach, simply stating facts, avoiding blame (e.g., inferred causes), and acting as dispassionate analysts when analyzing GTM problems. While you will eventually need to ask why you have certain problems, it’s always best to start with simple statements of fact, get agreement on them, and build from there. For example:
“We consistently start quarters with insufficient pipeline coverage” is a blameless statement of fact. It does not say whose job it is to generate pipeline (if that’s even been detailed out across sources) or why they are failing to do so.
“We are converting a below-normal percentage of our week 3 pipeline,” less obviously, is also a blameless statement of fact. While it’s clearly the job of sales to convert pipeline, the statement makes no assertion as to why we are seeing abnormally low conversion rates (e.g., pipeline quality, change in competitive market, sales execution).
When it comes to metrics, the first of the above questions is measured by pipeline coverage, more precisely week-3 pipeline coverage [4] [5]. The second is measured by a conversion rate, specifically week-3 pipeline conversion rate. Notably, this is not a win rate, and please read this post to ensure that you understand why.
Are We Giving Sales a Chance to Hit the Number?
Make a chart like this one to answer this question.
Here you see, for newbiz ARR for the trailing nine quarters, week 3 pipeline dollars, week 3 pipeline coverage (pipeline/plan), ARR booked, week-3 pipeline conversion, and the pipeline coverage target implied by the week-3 conversion rate (i.e., its inverse). Pipeline conversion rates are more interesting when viewed in conjunction with plan attainment, so I’ve added ARR plan and plan attainment as well.
Analyzing this chart, we can see a few things:
From 1Q22 through 1Q23 we converted about 33% of the pipeline
We were also consistently hitting plan in that timeframe
Starting 2Q23 we started with only 2.3x coverage, converted a healthy 40% of it, but still came up short, at 91% of plan.
That rough pattern continued in 3Q23 and 4Q23
1Q24 started with the weakest coverage in the past nine quarters (1.9x)
While sales is forecasting record conversion of that pipeline (45%), we are nevertheless forecasting to land at only 86% of plan
I’m not sure I believe the forecast because 45% conversion is borderline unrealistic and could simply be the CRO trying their best to hold the line
I conclude that this company is starting with insufficient pipeline. That is, they’re not giving sales a chance to hit the number. How do I conclude that?
By comparison to pipeline coverage benchmarks. 3.0x is the typical pipeline coverage goal and you’ll note that in the good times (1Q22 through 1Q23) we consistently started with 3.0x+ and we consistently made plan.
By comparison to pipeline conversion benchmarks. 33% is a standard conversion rate. Here we are running at 40%+, which is best-in-class conversion. Pipeline conversion is not the problem.
More importantly, by comparison to ourselves. In our recent history, we consistently made plan when we started with 3.0x+ coverage and missed it when we started with 2.3 to 2.4x. This quarter (1Q23) we’re starting with 1.9x, forecasting record conversion, and still only 86% of plan.
Here are some of the high-level steps in making that plan:
Define pipeline generation targets across the four major pipeline sources. It’s surprising how many companies don’t start with this basic step. For bonus points, over-allocate the goals to target 110% of what you need. [6]
I prefer to set these targets by opportunity count, not pipeline dollars, because I think it’s more visceral and less easily gamed [7].
Do a cost/oppty analysis across your pipeline sources to get an idea of how much money any given pipeline source (e.g., alliances, demandgen) would need to create, for example, 20 more oppties next quarter. Remember to focus on variable, not average, cost [8].
Be sure to check with the leader of each pipeline source on their ability to absorb extra money to generate more pipeline. If you have 12 SDRs reporting to one manager, they may need to bring in another manager before hiring 3 more SDRs. Alternatively, sellers may have extra time on their hands and the ability to put more time into outbound. Alliances may have a hot candidate they want to hire, but no open headcount, and could execute quickly if one were opened. It’s not just about money; it’s about the ability to productively spend it.
Accept that you may be overallocated to sales versus pipeline generation. In this case, the best solution might well be to terminate the bottom N sellers and convert the newly liberated budget to pipeline generation — so that everyone else has a chance at success. This is painful, but sometimes necessary, and after you’ve had to do it once, you’ll be more careful to plan holistically in the future.
This all goes without saying that no pipeline analytics will work if you lack basic pipeline discipline – i.e., if you don’t have clear definitions for stages, close dates, oppty values, and forecast categories, and if you don’t regularly enforce them via periodic pipeline scrubs.
The Floating Bar Problem
Before diving into pipeline conversion, let’s address a special case of insufficient pipeline: one where the pipeline initially looks sufficient but burns off at an above-average rate across the quarter. You can see this by looking weekly at to-go pipeline coverage.
What’s usually happening in these cases is that some material percentage of your week-3 pipeline is effectively fake. This happens because, when pipeline is scarce and if sellers are under pressure to each carry 3x coverage [9], they will take lower-quality opportunities into their pipeline. For example, long-shot oppties that appear rigged for the competition, immature oppties where sellers hope to create a buying timeline, or self-nurture leads that may only become real oppies in the future.
I call the tendency to work on lower quality oppties in tough times, the “floating bar problem” because sales silently lowers (or in good times, raises) the bar for admission into the pipeline. This is insidious because the result is fake pipeline that creates an illusion of coverage which disappears as the quarter progresses.
The solution to his problem is simple in theory, but hard in practice.
Sales management needs to hold the line on what gets into the pipeline, applying the same standards in tough times as good ones.
If sales management wants to allow sellers to work on low probability “oppties,” that’s fine but, well, get them out of the opportunity management system. Use tasks to track work. But only promote a lead to an oppty when it meets the standard for being an oppty.
If, for example, SDRs are passing low quality stage-1 oppties to sales that should not show up in the numbers as a reduced pipeline conversion rate. Instead, it should show up in a higher stage-2 rejection rate. This point is completely lost on most sales managers so please make sure you understand it. If you maintain pipeline discipline, lower quality oppties should show up not as a reduced stage-2 to close rate, but as an increased stage-2 rejection rate. And pipeline discipline starts at stage 2 – where sales decides to accept or reject oppties. It’s wrong to accept sub-standard oppties, pollute the oppty management system with fake pipeline, convert little of it, miss plan, and wreck the company’s pipeline analytics in the process.
I’m not trying to prevent sales from working on whatever sales management wants them to work on. But I am saying one thing: whatever they are, don’t call them oppties in “my” oppty management system if they don’t meet the defined standards for oppties [10].
Is Sales Converting Enough of the Pipeline?
While it’s the job of sales to convert pipeline into ARR, that doesn’t mean sales execution is the only factor that drives conversion rates.
Here you see conversion rates plummeting, dropping by 11 percentage points between 1Q23 and 2Q23 and then by another 5 percentage points by 4Q23. By the 1Q24 forecast, the pipeline conversion rate has been effectively cut in half from ~32% to ~16%. Note that during the recent dark times (from 2Q23 to 1Q24) we have been starting with ~3.0x pipeline coverage, but converting so little that we’re landing in the dismal range of 47% to 65% of plan.
Let’s assume we have the operational basics covered, so this is real pipeline, validated and scrubbed by sales management, and held to consistent standards over time. But we’re converting a lot less of it than we used to. Thus, I conclude that the company’s problem is pipeline conversion, not pipeline coverage.
What possible factors could be driving reduce pipeline conversion rates? Well, there are a lot of them, so we’ll talk about each.
Changes in averages (i.e., ceteris non paribus). Most productivity models assume a constant average sales price (ASP) and average sales cycle length (ASC). If ASPs go down, you will hit your count-based targets, but miss your dollar-based ones. If ASCs increase you may preserve your eventual close rates, but stretch them out over time, reducing quarterly conversion rates and plan attainment.
ASP decreases. Typically, due to budgetary pressure and increased price competition, but also can be due to an overreliance on discounting. Some of this is inevitable in a downturn. You can mitigate it through pricing and packaging changes (e.g., new add-ons to preserve price and/or offset churn at renewal).
Slip rate increases. When ASCs lengthen, more deals slip to the following quarter(s). Pipeline scrubs can provide early detection and deals reviews can offer re-acceleration strategies. The biggest risk is that these deals never close at all and simply hit no-decision or derail.
Win rate decreases. Win rates usually decrease when a new competitor enters the market or when an existing competitor leapfrogs your product or your market position (e.g., passes you in market share). Competitive research, sales training, and selling the roadmap are the usual responses.
An absence of big deals. Some CROs run their business as a mix of baseline deals to hit say 60-80% of plan, topped up by big deals that provide the rest. During a downturn those big deals may evaporate leaving only the run-rate business. The usual response is a strategic accounts program to focus on generating big deals and a focus on pipeline generation in the run-rate business to cover the gap.
Pipeline substitution. This is a subtle problem due to a change in pipeline mix, with low-converting pipeline substituting for high-converting pipeline. This is dangerous because you “look covered” at the start of the quarter but end up below plan at the end. Let’s drill in a bit here.
Pipeline Substitution
Not all pipeline is created equal. Pipeline for certain products often converts at a higher rate than others. Pipeline conversion rates typically vary by source, e.g., with outbound SDRs typically converting at a low rate and alliances converting at a high rate. Pipeline conversion might also vary by geography, with established geographies delivering high conversion rates than emerging ones.
See this chart for an example:
In this example, we start every quarter with $10M in pipeline. In 1Q23 through 3Q23 we convert 25% of it, but in 4Q23 we convert only 20%. What happened? The pipeline mix changed. Starting in 4Q23, we substituted $2M in high-converting pipeline (from sales/outbound and alliances) with $2M in low-converting pipeline (from SDR/outbound). Blended pipeline conversion thus dropped from 25% to 20% as a result of this change, effectively substituting nutrient-rich pipeline for nutrient-poor pipeline while keeping the overall amount the same.
Identifying these problems is a lot of work because you’ll need to segment pipeline by multiple variables — such as pipeline source, product, geography, business segment (e.g., enterprise vs. corporate accounts) – to get historical average conversion rates and percent mix, and then see if changes in pipeline composition are driving reductions in conversion rates. If so, the usual solution is to re-aim your pipeline generation back to the high-converting segments.
In this post, we have shown how you can troubleshoot go-to-market problems by splitting the funnel in two and focusing on two questions:
Are we giving sales the change to hit the number each quarter, as measured by pipeline coverage.
Is sales converting enough of the pipeline to hit the number, as measured by pipeline conversion.
I’ve also provided numerous notes and links that you can use to deepen your knowledge of how to solve these problems.
# # #
Notes
[1] The same analysis approach can easily apply to expansion ARR, which should be analyzed independently via its own funnel because it typically has different conversion rates and shorter sales cycles.
[2] Deadheads will understand that I had to resist writing, “nothing else shaking, so you might just as well.”
[3] Think: given that we’re off rails, forget the plan for a minute and let’s analyze what do we need to do to add $4M in newbiz ARR every quarter? This liberates you from needless, complexifying math that makes it harder to see the answer and is a great way to start in the crawl-walk-run exercise of getting back on track.
[4] More precisely, day-1, week-3, current-quarter pipeline coverage. Snapshotting Sunday night before the start of week 3 gives you a consistent point to compare across quarters. Waiting until the start of week 3 gives sales (more than) enough time to clean up the pipeline after the end of the prior quarter but is still early enough to be considered “starting pipeline.” Note that you may need to apply corrections for any deals that close in the first two weeks of the quarter. A high-class problem, at least.
[6] There is a cost to this type of insurance; it’s not great for your CAC ratio if you don’t end up over-performing plan (which ceteris paribus, starting with 110% of your pipeline target, you should). But it does reduce the risk of missing plan. To me, the correct sequence is to focus on making plan first, before focusing on efficiency — but you need to have the cash to underwrite that philosophy.
[7] For example, one big deal that masks what’s otherwise a pipeline starvation situation. If you’re going to set targets on dollars (which typically involves using some placeholder value) then you should create the oppties with a close date far in the future (e.g., one year) that sales can pull forward once they further qualify the account. The alternative is usually generating lots of fake pipeline that is auto-dumped into next quarter that gets pushed out in the first weeks of the quarter. Also, see this for more on ensuring pipeline coverage by seller, and not just in aggregate.
[8] You’re not going to hire an extra CMO, an extra PR agency, and an extra product marketer to generate 20 more oppties. Those costs are effectively fixed.
[9] And putting them under such pressure can run in diametric opposition to pipeline discipline and enforcing pipeline standards by encouraging reps to enter dubious deals as pipeline to get their manager off their backs.
[10] I say “my” oppty management system to remind people that carrying sub-standard oppties has impacts well beyond themselves and that oppty management system is the company’s property, not theirs. For old movie fans, when speaking of the oppties in “my” oppty management system, I’m always reminded of Cool Hand Luke: “what’s your dirt doing in Boss Keen’s ditch?”
I was thrilled to get together with Janessa Lantz (former CMO at dbt Labs) to join her and Amrita Gurney’s podcast, Standout Startup Brands, to discuss a topic that most people don’t even want to talk to me about — branding!
Yes, I’m known as something of a brandcurmudgeon, but I’m also very much a marketer and I do care a lot about branding — but approach it with pragmatism, caution, and healthy skepticism.
To me, branding is about trust. My definition is quite meta, but it’s trusing that you will be you. Trusting that you look like you. That you sound like you. That you act like you. That your execution is consistent with your vision. Basically, have you defined a clear character and are you staying within it? You be you.
It starts with hygiene factors: is your corporate image even professional? Is your copy error-free and mechanically consistent (e.g., via style guide). They’re called hygiene factors because you get punished if you land beneath the bar, but get no extra credit for being above. For example, you might not hire someone who arrives in very dirty clothes, but I doubt you’ll pick the top candidate based because they wore the cleanest. So any money invested in coming in above the bar is effectively wasted. Clear the bar, but by an inch.
Consistent messaging across deliverables is arguably a hygiene factor. I wouldn’t think your terribly professional if I heard a different story across SDRs, sales, the website, a live webinar, and in reviews from industry analysts. Consistency is key to communications effectiveness, but it’s also a hygiene factor. Some people notice. The smart ones, I think.
You can stay consistent by making a marketing blueprint deck, a deck that captures the answers basic questions (what is it, what are the benefits of using it, why is it different, etc.) in a master deck that you continually update and reference as you build marketing deliverables.
Consistency is hard with genius founders who often have too many great ideas. To manage this, you need to get their buy-in about their best delivery and then standardize on it. And then hold accountable for not changing it every day.
If there’s a technical story behind your product, you should make a seminal white paper that tells it in about 8-12 pages. You’ll be surprised how hard this is — particularly with platform software — and it will help you both tighten your story and tell it consistently. It’s literally the first thing you should at a zero-to-one startup on the marketing front. (Writing it will also help you get started on the style guide.)
Why do I say “wait until you’re $100M until you focus on brand?” or “if you want to build a brand, go sell some software?” Because capital-B branding — hiring an agency that has no intent on tightening product message or increasing pipeline, but instead helps you determine brand values, brand promise, brand platform, etc. — usually can wait. Some marketers want to do it too early. Heck, it’s fun. But don’t do it too early. Simply put, if you’re $15M and not growing, nobody actually cares what you stand for. So don’t spend $300K trying to figure it out. Get big enough to be relevant, then tighten up who you think you are.
Most $100M companies still don’t have tight product and corporate messaging. Get your priorities right. Fill the pipeline. Helps sales win deals with product, competitive, and corporate messaging. And when all that is working (and if you’re hearing about troubles due to a lack of branding) then go hire an agency to work on capital-B branding. And I am not universally opposed to this! For example, I recently had a great experience with Twenty-First Century Brand on a branding project. My argument isn’t never. It’s be sure you’re doing it at the right time and place in your evolution.
Building a strong leadership message will help you win more deals than capital-B branding, so do it first. If you can convince people that you are the technology leader, the market leader, and the vision leader, you are going to win a ton of deals in a growing category. Why wouldn’t you want to buy from someone who you thought was all three?
I view content marketing and thought leadership as demand generation, not branding. So that may be a source of confusion as well. Kellblog itself is demand generation and awareness generation for my serivces as a advisor or board member. It monetizes indirectly and is more demand generation than demand capture, but it works and I practice what I preach in this department.
Lot’s wife‘s law (don’t look back) — why you should never communicate externally about smaller competitors.
Why, in competitive, the rule should be, “if they go low, we go lower” and not, “we go high.” Enterprise software sales is a full-contact sport. You need to train and arm your sellers to go play it. In a perfect world, they’re so well trained that they’re eagerly waiting what used to be the toughest attack points.
The other rule is, “when they go low, we get on the phone.” Never try to resolve competitor attacks via email. Use the attack as an opportunity to get on the phone and spend more time with the customer.
Why you should allocate enough budget to measure your external demand funnel: awareness, opinion, consideration, trial, purchase.
How to combat the age-old, “if we just had more at-bats we’d win more deals” or “nobody’s ever heard of us” claims from sales.
Thanks again to Amrita and Janessa for having me. The episode is here.
I was reading a SaaS benchmark report the other day and encountered this line:
“Win rates declining [over the two-year period] from 23% to 19% might not seem all that significant. But in terms of required pipeline, it represents a dramatic shift from 4.3x to 5.3x coverage.”
It’s the kind of sentence that you might read, nod your head in hasty agreement, and then keep going. But you’d be wrong to do that. Quite wrong. And a lot of people make this mistake.
Thus, in this post, I’ll explain why it’s wrong to invert win rate to calculate target pipeline coverage, demonstrate that with a spreadsheet, and then give you a better way to determine target pipeline coverage.
Before diving into the math, let’s take a second to sanity check the conclusion reached above: you’re going to need 5.3x pipeline coverage [1]. Given that the rule of thumb for pipeline coverage is 3.0x, how do we feel about requiring 5.3x? My thoughts [2]:
I wonder who’s going to generate that? In many companies, it’s primarily marketing. So this potentially passing the buck: “hey marketing, we’re not closing as much as we used to, so we need more coverage.” It’s your problem, now.
At what cost? Let’s say that it costs $4K to generate a sales-accepted (aka, stage 2) opportunity [3]. If we needed 3x coverage before — e.g., 30 opportunities (“oppties”) to generate 10 deals — now we are going to need 53. That’s 23 more oppties at an incremental cost of $92K. Who’s going to pay for that? What’s that going to do to our CAC ratio and CPP?
Why do we lose so much? Sales is telling us that they can win only 19% of the oppties that they accept as valid sales oppties? That strikes me as low. If a tougher macro environment means lower quality stage 1 oppties, then why is sales accepting them? Lower quality stage 1 opportunities should show up in a higher stage 2 rejection rate, not a lower win rate [4].
So, if the answer is that we need 5.3x pipeline coverage to make plan, I’m going to have a lot of questions without doing any math at all. But now, let’s cut to the math.
What is Win Rate?
Most people define win rate as follows:
For all oppties that reached a terminal state during the quarter, win rate = wins / (wins + losses). I call this narrow win rate because it excludes no-decisions (also known as derails) where an oppty hits a terminal state without anyone winning it — for example, where the customer decided to stick with the status quo or the whole evaluation gets derailed by a surprise merger [5]. Because derails can happen a lot [6], I define an additional metric, broad win rate = wins / (wins + losses + derails).
Note that both of these win rates exclude slips, when the close date for an opportunity is moved out of the current quarter into a future one. Slips happen a lot. In fact, my basic rule of thumb is you win a third, you lose a third, and you slip a third [7]. Also note that I’m doing this on a count basis, not a dollar basis, which is my default preference [8].
You should already see why inverting win rate is not a great way to determine pipeline coverage requirements:
It’s ambiguous. Which win rate, narrow or broad?
Slips are common, but excluded from win rates. (Definitionally, because slipped oppties do not hit a terminal state in the quarter.)
The timing is wrong. We use pipeline coverage at the start of the quarter to see if we have a chance at hitting the number. But win rates are based on when oppties die, not their start-of-quarter status.
What is Close Rate?
I define close rate as a cohort-based metric that answers the question: given a set of oppties, what percent of them do we close/win [9] in some time period. For example, the six-quarter close rate for the cohort of stage-2 oppties created in 1Q22 = oppties in the cohort closed in the period [1Q22 to 3Q23] / oppties created in 1Q22. Let’s show it with an example:
The first block shows oppty count, the second shows percent. Here, we see a 27% six-quarter close rate. You can also run a cumulative rate along the bottom of the table that would show, for example, that the four-quarter close rate is 23%.
Win rates are period metrics that tell you what happened to the oppties that a hit a terminal state in a given period. Close rates are cohort metrics that tell you, in the fullness of time, the percent of a set of oppties that we win.
They are different.
They are both valuable.
Win rates are great for tracking progress against the enemy.
Neither is good if you want to invert something to find required pipeline coverage.
Week 3 Pipeline Conversion Rate
Let’s look at a different metric. Instead of starting with the fate of oppties in the pipeline, let’s start with an early-quarter snapshot of the current-quarter pipeline and then compare it to how much we close. Ideally, we’d take the snapshot on day one of the quarter, but that’s not realistic because sales invariably needs some clean-up time after the end of a quarter. Ergo, I typically use week-3 starting pipeline. If you have a monthly cadence, I’d suggest doing this same analysis on a monthly basis and using day-3 starting pipeline [10]. You can then calculate week-3 pipeline conversion rate = new ARR closed / week-3 starting pipeline. See [11] for some notes on this metric.
Because the conversion rates often differ significantly between new and expansion business, most people segment week-3 pipeline conversion rate by new business (newbiz) vs. expansion. In my endless desire to keep things simple, I always start with the total, unsegmented pipeline and break it out later if I need to. The reality is that while the conversion rates are different, if the mix remains roughly constant, it all comes out in the wash.
Here’s a table to show this concept at work:
To get implied target pipeline coverage, I take a trailing nine-quarter average of the week-3 pipeline conversion rate (34%) and then invert it to get 2.86. You could also have fun with the percent-of-plan row, asking questions like: what pipeline coverage do we need to hit plan 90% of the time?
In this post, I’ve hopefully blown a hole in the conventional wisdom that you can invert win rate to get target pipeline coverage. And I’ve provided a far better metric for accomplishing that task: week-3 pipeline conversion rate.
[1] When I used to help my kids with math homework, I’d always include a sanity check review of the answer. If you’re calculating the mean summer temperature in Alaska and the answer is 451 degrees, then go back and check your work.
[2] And I find that rule of thumb high in many situations. At the last company I ran, we could consistently hit plan with 2.5x coverage.
[3] In practice, the average cost of a stage 2 oppty varies considerably. I think a range of $2K to $10K probably covers 90% of cases, with a mean around $4-5K. These are mid-market and enterprise figures. SMB is presumably cheaper. These are sales-accepted so the cost is equivalent to your stage 1 oppty cost dividied by your stage 2 acceptance rate (typically 60-80%).
[4] Yes, I’m aware of the “desperation effect” whereby sellers with weak pipeline accept lower-quality opportunities, but sales management must fight to hold some objective quality bar to preserve pipeline discipline, to ensure resources are only put against quality oppties, and to ensure the validity of pipeline analysis. So yes, the effect is real, but it’s sales management’s job to limit it. (See the “floating bar” problem discussed here.)
[5] Many people code no-decisions as losses and then have a reason code for no-decision. I think this potentially blurs up win/loss analysis because losing to a competitor is different from a no-decision. (Plus, it usually precludes putting no-decision codes on no-decisions which I also want.) The fact is they are two different cases: losing to a competitor vs. an evaluation process ending without selecting a winner.
[6] Particularly in new markets where people are primarily exploring whether they want to buy one at all. In more developed markets — where the customer is more likely thinking, “I’m going to buy one, the question is which” — you should see lower derail rates. And those derails should be more surprise-driven — e.g., we got acquired, the CFO quit, we missed a quarter, we failed an audit, we’re being sued, etc.
[7] Which implies in a 50% narrow win rate, a 33% broad win rate, a 33% slip rate. This is realistic if you are one of two competitors going head-to-head in a market segment. If it’s more of a horse race, I’d expect to see a lower rate. Also, the “a third, a third, a third” rule excludes derails which you can skim off the top. For example, if 20% derail and the balance split by thirds, then you win 27%, lose 27%, and slip 27% of your deals.
[8] I prefer counts to dollars because they’re more visceral and less messed up by big deals. If you are running two sales motions (e.g., corporate and enterprise), I’d first try to stay count-based, but segment the analysis before going to a dollar basis. But there’s a time and a place for both.
[9] Which some might prefer to think of as a “closed/won rate,” but that’s too many syllables for me.
[10] Both generously allows about 10% plus or minus of the period to elapse before snapshotting: 3 days out of 30 (10%) and, depending on how you calculate weeks and what day the quarter starts on, up to 14 days out of 91 (15%).
[11] This assumes (a) sales cycles much longer than the period (e.g., 6-12 months) and (b) no sales are made prior to the snapshot. It ignores (a) deal expansion or shrinkage after week 3, and (b) where closed/won deals came from (e.g., they may be in the week-3 snapshot, created after it, or pulled-forward from a future quarter). This asymmetry bothers some people but it’s really supposed to be a macro measure. The real risk you face using it is when ceteris aren’t paribus.
I’m Dave Kellogg, advisor, director, blogger, and podcaster. I am an EIR at Balderton Capital and principal of my own eponymous consulting business.
I bring an uncommon perspective to enterprise software, having more than ten years’ experience in each of the CEO, CMO, and independent director roles in companies from zero to over $1B in revenues.
From 2012 to 2018, I was CEO of Host Analytics, where we quintupled ARR while halving customer acquisition costs, ultimately selling the company in a private equity transaction.
Previously, I was SVP/GM of the $500M Service Cloud business at Salesforce; CEO of MarkLogic, which we grew from zero to $80M over six years; and CMO at Business Objects for nearly a decade as we grew from $30M to over $1B in revenues.
I love disruptive startups and and have had the pleasure of working in varied capacities with companies including Bluecore, FloQast, Gainsight, Hex, Logikcull, MongoDB, Pigment, Recorded Future, Tableau, and Unaric.
I currently serve on the boards of Cyber Guru, Light, Scoro, TechWolf, and Vic.ai. I have previously served on boards including Alation, Aster Data, Granular, Nuxeo, Profisee, and SMA Technologies.