Bookings vs. Billings in a SaaS Company

Financial analysts speak a lot about “billings” in a public SaaS companies, but in private VC-backed SaaS companies, you rarely hear discussion of this metric.  In this post, we’ll use a model of a private SaaS company (where we know all the internal metrics), to show how financial analysts use rules of thumb to estimate and/or impute internal SaaS metrics using external ones – and to see what can go wrong in that process.

For reference, here’s an example of sell-side financial analyst research on a public SaaS company that talks about billings [1].

saas1-zen

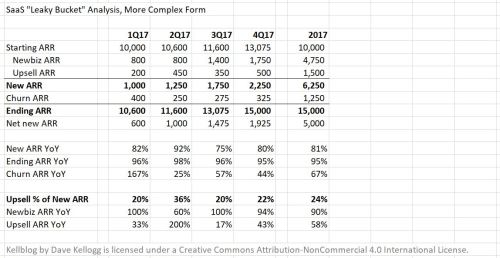
Let’s start with a quick model that builds up a SaaS company from scratch [1].  To simplify the model we assume all deals (both new and renewal) are for one year only and are booked on the last day of the quarter (so zero revenue is ever recognized in-quarter from a deal).  This also means next-quarter’s revenue is this-quarter’s ending annual recurring revenue (ARR) divided by 4.

saas13

Available to renew (ATR) is total subscription bookings (new and renewal) from four quarters prior.  Renewal bookings are ATR * (1 – churn rate).  The trickiest part of this model is the deferred revenue (DR) waterfall where we need to remember that the total deferred revenue balance is the sum of DR leftover from the current and the prior three quarters.

If you’re not convinced the model is working and/or want to play with it, you can download it, then see how things work by setting some drivers to boundary conditions (e.g., churn to 0%, QoQ sales growth to 0, or setting starting ARR to some fixed number [2]).

 The Fun Part:  Imputing Internal Metrics from External Ones

Now that we know what’s going on the inside, let’s look in from the outside [3]:

  • All public SaaS companies release subscription revenues [4]
  • All public SaaS companies release deferred revenues (i.e., on the balance sheet)
  • Few SaaS companies directly release ARR
  • Few SaaS companies release ATR churn rates, favoring cohort retention rates where upsell both masks and typically exceeds churn [5]

It wasn’t that long ago when a key reason for moving towards the SaaS business model was that SaaS smoothed revenues relative to the all-up-front, lumpy on-premises model.  If we could smooth out some of that volatility then we could present better software companies to Wall Street.  So the industry did [6], and the result?  Wall Street immediately sought a way to look through the smoothing and see what’s really going on in the inherently lumpy, backloaded world of enterprise software sales.

Enter billings, the best answer they could find to do this.  Billings is defined as revenue plus change in deferred revenue for a period.  Conceptually, when a SaaS order with a one-year prepayment term is signed, 100% of it goes to deferred revenue and is burned down 1/12th every month after that.  To make it simple, imagine a SaaS company sells nothing in a quarter:  revenue will burn down by 1/4th of starting deferred revenue [7] and the change in deferred revenue will equal revenue – thus revenue plus change in deferred revenue equals zero.  Now imagine the company took an order for $50K on the last day of the quarter.  Revenue from that order will be $0, change in deferred will be +$50K, implying new sales of $50K [8].

Eureka!  We can see inside the SaaS machine.  But we can’t.

Limitations of Billings as a SaaS Metric

If you want to know what investors really care about when it comes to SaaS metrics, ask the VC and PE folks who get to see everything and don’t have to impute outside-in.  They care about

Of those, public company investors only get a clear look at subscription gross margins and the customer acquisition cost (CAC) ratio.  So, looking outside-in, you can figure out how efficiency a company runs its SaaS service and how efficiently it acquires customers [9].

But you typically can’t get a handle on churn, so you can’t calculate LTV/CAC or CAC Payback Period.  Published cohort growth, however, can give you comfort around potential churn issues.

But you can’t get a precise handle on sales growth – and that’s a huge issue as sales growth is the number one driver of SaaS company valuation [10].  That’s where billings comes into play.  Billings isn’t perfect because it shows what I call “total subscription bookings” (new ARR bookings plus renewal bookings) [11], so we can’t tell the difference between a good sales and weak renewals quarter and a bad sales and a good renewals quarter.

Moreover, billings has two other key weaknesses as a metric:

  • Billings is dependent on prepaid contract duration
  • Companies can defer processing orders (e.g., during crunch time at quarter’s end, particularly if they are already at plan) thus making them invisible even from a billings perspective [12]

Let’s examine how billings depends on contract duration.  Imagine it’s the last day of new SaaS company’s first quarter.  The customer offers to pay the company:

  • 100 units for a prepaid one-year subscription
  • 200 units for a prepaid two-year subscription
  • 300 units for a prepaid three-year subscription

From an ARR perspective, each of the three possible structures represents 100 units of ARR [13].  However, from a deferred revenue perspective, they look like 100, 200, 300 units, respectively.  Worse yet, looking solely at deferred revenue at the end of the quarter, you can’t know if 300 units represents three 100-unit one-year prepay customers or a single 100-unit ARR customer who’s done a three-year prepay.

In fact, when I was at Salesforce we had the opposite thing happen.  Small and medium businesses were having a tough time in 2012 and many customers who’d historically renewed on one-year payment cycles started asking for bi-annual payments.  Lacking enough controls around a rarely-used payment option, a small wave of customers asked for and got these terms.  They were happy customers.  They were renewing their contracts, but from a deferred revenue perspective, suddenly someone who looked like 100 units of deferred revenue for an end-of-quarter renewal suddenly looked 50.  When Wall St. saw the resultant less-than-expected deferred revenue (and ergo less-than-expected billings), they assumed it meant slower new sales.  In fact, it meant easier payment terms on renewals – a misread on the business situation made possible by the limitations of the metric.

This issue only gets more complex when a company is enabling some varying mix of one through five year deals combined with partial up-front payments (e.g., a five-year contract with years 1-3 paid up front, but years 4 and 5 paid annually).  This starts to make it really hard to know what’s in deferred revenue and to try and use billings as a metric.

Let’s close with an excerpt from the Zuora S-1 on billings that echoes many of the points I’ve made above.

saas3

Notes

[1] Source:  William Blair, Inc., Zendesk Strong Start to 2018 by Bhavan Suri.

[2] Even though it’s not labelled as a driver and will break the renewals calculations, implicitly assuming all of it renews one year later (and is not spread over quarters in anyway).

[3] I’m not a financial analyst so I’m not the best person to declare which metrics are most typically released by public companies, so my data is somewhat anecdotal.  Since I do try to read interesting S-1s as they go by, I’m probably biased towards companies that have recently filed to go public.

[4] As distinct from services revenues.

[5] Sometimes, however, those rates are survivor biased.

[6] And it worked to the extent that from a valuation perspective, a dollar of SaaS revenue is equivalent to $2 to $4 of on-premises revenue.  Because it’s less volatile, SaaS revenue is more valuable than on-premises revenue.

[7] Provided no customers expire before the last day of the quarter

[8] Now imagine that order happens on some day other than the last day of the quarter.  Some piece, X, will be taken as revenue during the quarter and 50 – X will show up in deferred revenue.  So revenue plus change in deferred revenue = it’s baseline + X + 50 – X = baseline + 50.

[9] Though not with the same clarity VCs can see it — VCs can see composition of new ARR (upsell vs. new business) and sales customers (new customer acquisition vs. customer success) and thus can create more precise metrics.  For example, a company that has a solid overall CAC ratio may be revealed to have expensive new business acquisition costs offset by high, low-cost upsell.

[10] You can see subscription revenue growth, but that is smoothed/damped, and we want a faster way to get the equivalent of New ARR growth – what has sales done for us lately?

[11] It is useful from a cash forecasting perspective because all those subscription billings should be collectible within 30-60 days.

[12] Moving the deferred revenue impact of one or more orders from Q(n) to Q(n+1) in what we might have called “backlogging” back in the day.  While revenue is unaffected in the SaaS case, the DR picture looks different as a backlogged order won’t appear in DR until the end of Q(n+1) and then at 75, not 100, units.

[13] Normally, in real life, they would ask a small discount in return for the prepay, e.g., offer 190 for two years or 270 for three years.  I’ll ignore that for now to keep it simple.

The Leaky Bucket, Net New ARR, and the SaaS Growth Efficiency Index

My ears always perk up when I hear someone say “net new ARR” — because I’m trying to figure out which, of typically two, ways they are using the term:

  • To mean ARR from net new customers, in which case, I don’t know why they need the word “net” in there.  I call this new business ARR (sometimes abbreviated to newbiz ARR), and we’ll discuss this more down below.
  • To mean net change in ARR during a period, meaning for example, if you sold $2,000K of new ARR and churned $400K during a given quarter, that net new ARR would be $1,600K.  This is the correct way to use this term.

Let’s do a quick review of what I call leaky bucket analysis.  Think of a SaaS company as a leaky bucket full of ARR.

  • Every quarter, sales dumps new ARR into the bucket.
  • Every quarter, customer success does its best to keep water from leaking out.

Net new ARR is the change in the water level of the bucket.  Is it a useful metric?  Yes and no.  On the yes side:

  • Sometimes it’s all you get.  For public companies that either release (or where analysts impute) ARR, it’s all you get.  You can’t see the full leaky bucket analysis.
  • It’s useful for measuring overall growth efficiency with metrics like cash burn per dollar of net new ARR or S&M expense per dollar of net new ARR.  Recall that customer acquisition cost (CAC) focuses only on sales efficiency and won’t detect the situation where it’s cheap to add new ARR only to have it immediately leak out.

If I were to define an overall SaaS growth efficiency index (GEI), I wouldn’t do it the way Zuora does (which is effectively an extra-loaded CAC), I would define it as:

Growth efficiency index = -1 * (cashflow from operations) / (net new ARR)

In English, how much cash are you burning to generate a dollar of net new ARR.  I like this because it’s very macro.  I don’t care if you’re burning cash as a result of inefficient sales, high churn, big professional services losses, or high R&D investment.  I just want to know how much cash you’re burning to make the water level move up by one dollar.

So we can see already that net new ARR is already a useful metric, if a sometimes confused term.  However, on the no side, here’s what I don’t like about it.

  • Like any compound metric, as they say at French railroad crossings, un train peut en cacher un autre (one train can hide another).  This means that while net new ARR can highlight a problem you won’t immediately know where to go fix it — is weak net new ARR driven by a sales problem (poor new ARR), a product-driven churn problem, a customer-success-driven churn problem, or all three?

Finally, let’s end this post by taking a look and then a deeper look at the SaaS leaky bucket and how I think it’s best presented.

leaky1

For example, above, you can quickly see that a massive 167% year-over-year increase in churn ARR was the cause for weak 1Q17 net new ARR.  While this format is clear and simple, one disadvantage of this simpler format is that it hides the difference between new ARR from new customers (newbiz ARR) and new ARR from existing customers (upsell ARR).  Since that can be an important distinction (as struggling sales teams often over-rely on sales to existing customers), this slightly more complex form breaks that out as well.

leaky2

In addition to breaking out new ARR into its two sub-types, this format adds three rows of percentages, the most important of which is upsell % of new ARR, which shows to what extent your new ARR is coming from existing versus new customers.  While the “correct” value will vary as a function of your market, your business model, and your evolutionary phase, I generally believe that figures below 20% indicate that you may be failing to adequately monetize your installed base and figures above 40% indicate that you are not getting enough new business and the sales force may be too huddled around existing customers.

My Appearance on DisrupTV Episode 100

Last week I sat down with interviewers Doug Henschen, Vala Afshar, and a bit of Ray Wang (live from a 777 taxiing en route to Tokyo) to participate in Episode 100 of DisrupTV along with fellow guests DataStax CEO Billy Bosworth and big data / science recruiter Virginia Backaitis.

We covered a full gamut of topics, including:

  • The impact of artificial intelligence (AI) and machine learning (ML) on the enterprise performance management (EPM) market.
  • Why I joined Host Analytics some 5 years ago.
  • What it’s like competing with Oracle … for basically your entire career.
  • What it’s like selling enterprise software both upwind and downwind.
  • How I ended up on the board of Alation and what I like about data catalogs.
  • What I learned working at Salesforce (hint:  shoshin)
  • Other lessons from BusinessObjects, MarkLogic, and even Ingres.

DisrupTV Episode 100, Featuring Dave Kellogg, Billy Bosworth, Virginia Backaitis from Constellation Research on Vimeo.


The Question that CEOs Too Often Don’t Discuss with the Board

Startup boards are complex.  While all board members own stock in the company their interests are not necessarily aligned.

  • Founders may be motivated by a vision to change the world, to hit a certain net worth target, to see their name in an S-1, to make the Forbes 500, or — and I’ve seen crazier things — to make more than their Stanford roommate.  First-time founders with little net worth can be open to selling at relatively low prices.  Conversely, serial successful founders may need a large exit simply to move the needle on their net worth.  Founders can also be religious zealots and take positions like “I wouldn’t sell to Microsoft or Oracle at any price.”
  • Independent board members typically have significant net worth (i.e., they’ve been successful at something which is why want them on your board) and relatively small stakes which, by default, financially incents them to seek large exits.  While they notionally represent the common stock, they are often aligned with either the founders or one of the investors in the company — they got on the board for a reason, often existing relationships —  and thus their views may be shaped by the real or perceived interest of those parties.  Or, they can simply drive an agenda that they believe is best for the company — whatever they happen to think “best” means.
  • Venture capitalists (VCs) are motivated by generating returns for their funds.  Simple, right?  Not so fast.  VC is increasingly a “hits business” where a few large outcomes can mean the difference between at 10% and 35% IRR over a fund’s ten-year life.  Thus, VCs have a general tendency to seek huge exits (“better to sell too late than too early”), but they are also motivated by other factors such as the expectations they set when they raised their fund, the performance of other investments in the fund (e.g., do they need a big hit to bail out a few bad bets), and their relationships with members of other funds represented on the company’s board.

In this light, it’s clearly simplistic to say that everyone is aligned around a single goal:  to maximize the value of the stock.  Yes, surely that is true at one level.  But it gets a bit more complicated than that.
That’s why it’s so important that CEOs ask the board one question that, somewhat amazingly, they all too often don’t:  what does success look like?  And it doesn’t hurt to re-ask it every few years as any given board member’s position may change over time.
I’m always shocked how the simplest of questions can generate the most debate.
Aside:  back in the day at Business Objects (~1998), I suggested bringing in the Chasm Group to help us with a three-day, strategic planning offsite.  I figured we’d spend a morning reviewing the key concepts in Crossing the Chasm, at most one afternoon generating consensus on where we sat on their technology adoption lifecycle curve, and then two days working on strategic goals and operational plans after that.
Tech-Adoption-Lifecycle-01
With about 12 people who had worked together closely for years, after three full days we never agreed where we sat on the curve.  We spent literally the entire time arguing, often intensely, and never even got to the rest of the agenda.  Fortunately, that didn’t end up impeding our success, but it was a big lesson for me.  End aside.
So be ready for that simple question to generate a long answer.  Most probably, several long answers.  In fact, in order to get the best answer, I’d suggest asking board members about it first individually (to avoid any group decision-making biases) and then discuss it as a group.
But before examining the answers you can expect to this question, let’s take a minute to consider why this conversation doesn’t occur more often and more naturally.  I think there are three generic reasons:

  • Conflict aversion.  Perhaps sensing real misalignment, like in a bad marriage the CEO and board tacitly agree to not discuss the problem until they must.  You may hear or make excuses like “let’s cross that bridge when we come to it,”  “let’s execute this year’s plan and then discuss that,” or “if there’s no offer on the table then there’s nothing to discuss.”  Or, in a more Machiavellian situation, a board member may be thinking, “let’s ride Joe like a rented mule to $5M and then shoot him,” continuallying defer the conversation on that logic.  Pleasant or unpleasant, it’s usually better to address conflicts early rather than letting them fester.
  • Rationalization of unrealistic expectations.  If some board members constantly refrain “this can be a billion-dollar company,” perhaps the CEO rationalizes it, thinking “they don’t really believe that; they’re just saying it because they think they’re supposed to.”  But what if they do believe it?
  • The gauche factor.  Some people seem to think it’s a gauche topic of conversation.  “Hey, our company vision statement says we’re making the world a better place through elegant hierarchies for maximum code reuse and extensibility, we shouldn’t be focusing on something so crass as the exit, we should be talking about making the world better.”  VCs invest money for a reason, they measure results by the IRR, and they can typically cite their IRRs (and those of their partners) from memory.  It’s not gauche to discuss expectations and exits.

When you ask your board members what success looks like these are the kinds of things you might hear:

  • Disrupting the leader in a given market.
  • Building a $1B revenue company.
  • Becoming a unicorn ($1B valuation).
  • Changing the way people work.
  • Getting a 10x in 7 years for an early stage fund, or getting a 3x in 3-5 years for a later stage fund.
  • Showing my Mother my name in an S-1 (a sub-case of “going public”).
  • Getting our software into the hands of over 1M people.
  • Realizing the potential of the company.
  • Selling the company for more than I think it’s worth.
  • Getting acquired by Google or Cisco for a price above a given threshold.
  • Building a true market leader.
  • Creating a Silicon Valley icon, a household name.
  • Selling the company for {a base-hit, double, triple, home-run, or grand-slam} outcome.

Given the possibility of a list as heterogeneous as this, doesn’t it make sense to get this question on the table as opposed to in the closet?
I learned my favorite definition of strategy from a Stanford professor who defined strategy as “the plan to win.”  The beauty of this definition is that it instantly begs the question “what is winning?”  Just as that conversation can be long, contentious, and colorful, so is the answer to the other, even more critical question:  what does success look like?

The Single Biggest Myth about MBOs and OKRs

I’m a big believer in written quarterly goals.

The old way to do this was to adopt “management by objective” (MBO) and to write down a set of MBOs for each quarter for each team member.  Most folks would do this either in Word, or if they liked weightings and scores as part of calculating an MBO bonus, Excel.  Over time, larger enterprises adopted HR performance management software to help with managing and tracking those MBOs.  When writing individual objectives, you were advised that they be SMART (specific, measurable, attainable, realistic, time-bound).

Despite best intentions, over time MBOs developed a bad rap for several reasons:

  • People would make too many of them, often drowning in long lists of MBOs
  • Few people could write them well, so would-be SMART objectives ended SQUISH (soft, qualitative, unintelligible, imprecise, slang, and hazy) instead.
  • They were often hard-linked to compensation, encouraging system-gaming

The objective / key result (OKR) system is a more modern take on objective setting popularized by, among others, Google and venture capitalist John Doerr.  OKRs fix some of the key problems with MBOs.

  • A strong guideline to have no more than about 5 OKRs per person to avoid the drowning-in-MBOs problem.
  • Adding a tiny bit of structure (the key results) helps enormously with producing objectives that are specific and measurable.
  • A realistic and intelligently calibrated scoring system whereby 70% is considered a “good” grade.  The defeats a lot of the system gaming.

But, regardless of which system you’re using, you can still hear the following myth from some managers and HR professionals:

“Oh, wait.  The objectives shouldn’t list things in your core job.  They should be the things on top of your core job.”  Sometimes followed by, “who’d want to pay you a bonus just for doing your core job?”

This is just plain wrong.

Let’s make it clear via an example.  Say you’re a first-line technical support person whose job is to answer 20 cases per day.  To ensure you’re not just closing out cases willy-nilly, your company performs a post-case customer satisfaction (CSAT) survey and wants you to maintain a post-case CSAT rating of 4.5 out of 5.0.  In addition, the company wants you to do 6 hours of skills training and write 4 knowledge-base articles per month.

If you live by the myth that says written objectives should be above and beyond your core job then this person should have two quarterly objectives:

  • Write 4 knowledge-base articles per month.
  • Attend 6 hours of skills training per month.

This is simply insanity.  You are going to the trouble of tracking written objectives, but overlooking 90%+ of what this person actually does.  This person needs to have 3 quarterly objectives:

  • Close 100 cases per week with a 4.5+ CSAT rating
  • Write 4 knowledge-base articles per month
  • Attending 6 hours of skills training per month

And if we’re tying these to a bonus, most of the weight needs to be on the first one.

While I know I’ve argued this via reductio ad absurdum, I think it’s the right way to look at it.  If you’re going to track written objectives — by either MBO or OKR — then you should think about you the  entire job scope, be inclusive, and weight them appropriately.