Category Archives: FP&A

What Are The Units On Your Lead SaaS Metric — And What Does That Say About Your Culture

Quick:

  • How big is the Acme deal?  $250K.
  • What’s Joe’s forecast for the quarter?  $500K
  • What’s the number this year?  Duh.  $7,500K.

Awesome.  By the way:  $250K what?  $500K what?  $7,500K what?  ARR, ACV, bookings, TCV, new ARR, net new ARR, committed ARR, contracted ARR, terminal ARR, or something else?

Defining those terms isn’t the point of this post, so see note [1] below if interested.

The point is that these ambiguous, unitless conversations happen all the time in enterprise software companies.  This isn’t a post about confusion; the vast majority of the time, everyone understands exactly what is being said.  What those implicit units really tell you about is culture.

Since there can be only one lead metric, every company, typically silently, decides what it is.  And what you pick says a lot about what you’re focused on.

  • New ARR means you’re focused on sales adding water to the SaaS leaky bucket — regardless of whether it’s from new or existing customers.
  • Net New ARR means you’re focused the change in water level in the SaaS leaky bucket — balancing new sales and churn — and presumably means you hold AEs accountable for both sales and renewals within their patch.
  • New Logo ARR means you’re focused on new ARR from new customers.  That is, you’re focused on “lands” [2].
  • Bookings means you’re focused on cash [3], bringing in dollars regardless of whether they’re from subscription or services, or potentially something else [4].
  • TCV, which became a four-letter word after management teams too often conflated it with ARR, is probably still best avoided in polite company.  Use RPO for a similar, if not identical, concept.
  • Committed ARR usually means somebody important is a fan of Bessemer metrics, and means the company is (as with Net New ARR) focused on new ARR net of actual and projected churn.
  • Terminal ARR means you’re focused on the final-year ARR of multi-year contracts, implying you sign contracts with built-in expansion, not a bad idea in an NDR-focused world, I might add.
  • Contracted ARR can be a synonym for either committed or terminal ARR, so I’d refer to the appropriate bullet above as the case may be.

While your choice of lead metric certainly affects the calculations of other metrics (a bookings CAC or a terminal-ARR CAC) that’s not today’s point, either.  Today’s point is simple.  What you pick says a lot about you and what you want your organization focused on.

  • What number do you celebrate at the all hands meeting?
  • What number do you tell employees is “the number” for the year?

For example, in my opinion:

  • A strong sales culture should focus on New ARR.  Yes, the CFO and CEO care about Ending ARR and thus Net New ARR, but the job of sales is to fill the bucket.  Someone else typically worries about what leaks out.
  • A shareholder value culture would focus on Ending ARR, and ergo Net New ARR.  After all, the company’s value is typically a linear function of its Ending ARR (with slope determined by growth).
  • A strong land-and-expand culture might focus on Terminal ARR, thinking, regardless of precisely when they come in, we have contracts that converge to a given total ARR value over time [5].
  • Conversely, a strong land and expand-through-usage culture might focus on New Logo ARR (i.e., “land”), especially if the downstream, usage-based expansion is seen as somewhat automatic [6].
  • A cash-focused culture (and I hope you’re bootstrapped) would focus on bookings.  Think:  we eat what we kill.

This isn’t about a right or wrong answer [7].  It’s about a choice for your organization, and one that likely changes as you scale.  It’s about mindfulness in making a subtle choice that actually makes a big statement about what you value.

# # #

Notes
[1] For clarity’s sake, ARR is annual recurring revenue, the annual subscription value.  ACV is annual contract value which, while some treat as identical to ARR, others treat as first-year total contract value, i.e., first-year ARR plus year-one services.  Bookings is usually used as a proxy for cash and ergo would include any effects of multi-year prepayments, e.g., a two-year, prepaid, $100K/year ARR contract would be $200K in bookings.  TCV is total contract value which is typically the total (subscription) value of the contract, e.g., a 3-year deal with an ARR stream of $100K, $200K, $300K would have a $600K, regardless of when the cash payments occurred.  New ARR is new ARR from either new customers (often called New Logo ARR) or existing customers (often called Upsell ARR).  Net New ARR is new ARR minus churn ARR, e.g., if a regional manager starts with $10,000K in their region, adds $2,000K in new ARR and churns $500K, then net new ARR is $1,500K.  Committed ARR (as defined by Bessemer who defined the term) is “contracted, but not yet live ARR, plus live ARR netted against known projected ARR churn” (e.g., if a regional manager starts with $10,000K in their region, has signed contracts that start within an acceptable time period of $2,000K, takes $200K of expected churn in the period, and knows of $500K of new projected churn upcoming, then their ending committed is ARR is $11,500K.  (Why not $11,300K?  Because the $200K of expected churn was presumably already in the starting figure.)  Terminal ARR the ARR in the last year of the contract, e.g., say a contract has an ARR stream of $100K, $200K, $300K, the terminal ARR is $300K [1A].  Contracted ARR is for companies that have hybrid models (e.g., annual subscription plus usage fee) and includes only the contractually committed recurring revenues and not usage fees.

[1A] Note that it’s not yet clear to me how far Bessemer goes out with “contracted” ARR in their committed ARR definition, but I’m currently guessing they don’t mean three years.  Watch this space as I get clarification from them on this issue.

[2] In the sense of land-and-expand.

[3] On the assumptions that bookings is being used as a proxy for cash, which I recommend, but which is not always the case.

[4] e.g., non-recurring engineering; a bad thing to be focused on.

[5] Although if they all do so in different timeframes it becomes less meaningful.  Also unless the company has a track record of actually achieving the contractually committed growth figures, it becomes less credible.

[6] Which it never actually is in my experience, but it is a matter of degree.

[7] Though your investors will definitely like some of these choices better than others.


The Strategy Compiler: How To Avoid the “Great” Strategy You Couldn’t Execute

Few phrases bother me more than this one:

“I know it didn’t work, but it was a great strategy.  We just didn’t have the resources to execute it.”

Huh.  Wait minute.  If you didn’t have the resources to execute it, then it wasn’t a great strategy.  Maybe it was a great strategy for some other company that could have applied the appropriate resources.  But it wasn’t a great strategy for you.  Ergo, it wasn’t a great strategy.  QED.

I learned my favorite definition of strategy at a Stanford executive program I attended a few years back.  Per Professor Robert Burgelman, author of Strategy is Destiny, strategy is simply “the plan to win.”  Which begets an important conversation about the definition of winning.  In my experience, defining winning is more important than making the plan, because if everyone is focused on taking different hills, any resultant strategy will be a mishmash of plans to support different objectives.

But, regardless of your company’s definition of winning, I can say that any strategy you can’t execute definitionally won’t succeed and is ergo a bad strategy.

It sounds obvious, but nevertheless a lot of companies fall into this trap.  Why?

  • A lack of focus.
  • A failure to “compile” strategy before executing it.

Focus:  Think Small to Grow Big

Big companies that compete in lots of broad markets almost invariably didn’t start out that way.

BusinessObjects started out focused on the Oracle financials installed base.  Facebook started out on Harvard students, then Ivy league students.  Amazon, it’s almost hard to remember at this point, started out in books.  Salesforce started out in SMB salesforce automation.  ServiceNow on IT ticket management.  This list goes on and on.

Despite the evidence and despite the fame Geoffrey Moore earned with Crossing the Chasm, focus just doesn’t come naturally to people.  The “if I could get 1% share of a $10B market, I’d be a $100M company” thought pattern is just far too common. (And investors often accidentally reinforce this.)

The fact is you will be more dominant, harder to dislodge, and probably more profitable if, as a $100M company, you control 30% of a $300M target as opposed to 1% of a $10B target.

So the first reason startups make strategies they can’t execute is because they forget to focus.  They aim too broadly. They sign up for too much.  The forget that strategy should be sequence of actions over time.  Let’s start with Harvard. Then go Ivy League.  Then go Universities in general.  Then go everyone.

Former big company executives often compound the problem.  They’re not used to working with scarce resources and are more accustomed to making “laundry list” strategies that check all the boxes than making focused strategies that achieve victory step by step.

A Failure to Compile Strategy Before Execution

The second reason companies make strategies they can’t execute is that they forget a critical step in the planning process that I call the strategy compiler.  Here’s what I think a good strategic planning process looks like.

  • Strategy offsite. The executive team spends a week offsite focused on situation assessment and strategy.  The output of this meeting should be (1) a list of strategic goals for the company for the following year and (2) a high-level financial model that concretizes what the team is trying to accomplish over the next three years.  (With an eye, at a startup, towards cash.)
  • First round budgeting. Finance issues top-down financial targets.  Executives who own the various objectives make strategic plans for how to attain them.  The output of this phase is (1) first-draft consolidated financials, (2) a set of written strategies along with proposed organizational structures and budgets for attaining each of the company’s ten strategic objectives.
  • Strategy compilation, resources. The team meets for a day to review the consolidated plans and financials. Invariably there are too many objectives, too much operating expense, and too many new hires. The right answer here is to start cutting strategic goals.  The wrong answer is to keep the original set of goals and slash the budget 20% across the board.  It’s better to do 100% of 8 strategic initiatives than do 80% of 10.
  • Strategy compilation, skills. The more subtle assessment that must happen is a sanity check on skills and talent.  Do your organization have the competencies and do your people have the skills to execute the strategic plans?  If a new engineering project requires the skills of 5 founder-level, Stanford computer science PHDs who each would want 5% of a company, you are simply not going to be able to hire that kind of talent as regular employees. (This is one reason companies do “acquihires”).  The output of this phase is a presumably-reduced set of strategic goals.
  • Second round budgeting. Executives to build new or revised plans to support the now-reduced set of strategic goals.
  • Strategy compilation. You run the strategy compiler again on the revised plan — and iterate until the strategic goals match the resources and the skills of the proposed organization.
  • Board socialization. As you start converging via the strategy compiler you need to start working with the board to socialize and eventually sell the proposed operating plan.  (This process could easily be the subject of another post.)

If you view strategy as the plan to win, then successful strategies include only those strategies that your organization can realistically execute from both a resources and skills perspective.  Instead of doing a single-pass process that moves from strategic objectives to budgets, use an iterative approach with a strategy compiler to ensure your strategic code compiles before you try to execute it.

If you do this, you’ll increase your odds of success and decrease the odds ending up in the crowded section of the corporate graveyard where the epitaphs all read:

Here Lies a Company that Had a “Great” Strategy  It Had No Chance of Executing

CAC Payback Period:  The Most Misunderstood SaaS Metric

The single most misunderstood software-as-a-service (SaaS) metric I’ve encountered is the CAC Payback Period (CPP), a compound metric that is generally defined as the months of contribution margin to pay back the cost of acquiring a customer.   Bessemer defines the CPP as:

bess cac

I quibble with some of the Bessemerisms in the definition.  For example, (1) most enterprise SaaS companies should use annual recurring revenue (ARR), not monthly recurring revenue (MRR), because most enterprise companies are doing annual, not monthly, contracts, (2) the “committed” MRR concept is an overreach because it includes “anticipated” churn which is basically impossible to measure and often unknown, and (3) I don’t know why they use the prior period for both S&M costs and new ARR – almost everybody else uses prior-period S&M divided by current-period ARR in customer acquisition cost (CAC) calculations on the theory that last quarter’s S&M generated this quarter’s new ARR.

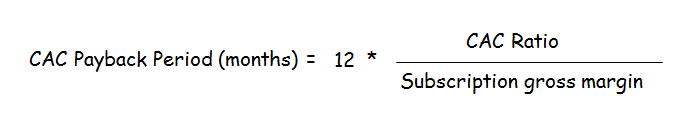
Switching to ARR nomenclature, and with a quick sleight of mathematical hand for simplification, I define the CAC Payback Period (CPP) as follows:

kell cac

Let’s run some numbers.

  • If your company has a CAC ratio of 1.5 and subscription gross margins of 75%, then your CPP = 24 months.
  • If your company has a CAC ratio of 1.2 and subscription gross margins of 80%, then your CPP = 18 months.
  • If you company has a CAC ratio of 0.8 and subscription gross margins of 80%, then your CPP = 12 months.

All seems pretty simple, right?  Not so fast.  There are two things that constantly confound people when looking at CAC Payback Period (CPP).

  • They forget payback metrics are risk metrics, not return metrics
  • They fail to correctly interpret the impact of annual or multi-year contracts

Payback Metrics are for Risk, Not Return

Quick, basic MBA question:  you have two projects, both require an investment of 100 units, and you have only 100 units to invest.  Which do you pick?

  • Project A: which has a payback period of 12 months
  • Project B: which has a payback period of 6 months

Quick, which do you pick?  Well, project B.  Duh.  But wait — now I tell you this:

  • Project A has a net present value (NPV) of 500 units
  • Project B has an NPV of 110 units

Well, don’t you feel silly for picking project B?

Payback is all about how long your money is committed (so it can’t be used for other projects) and at risk (meaning you might not get it back).  Payback doesn’t tell you anything about return.  In capital budgeting, NPV tells you about return.  In a SaaS business, customer lifetime value (LTV) tells you about return.

There are situations where it makes a lot of sense to look at CPP.  For example, if you’re running a monthly SaaS service with a high churn rate then you need to look closely how long you’re putting your money at risk because there is a very real chance you won’t recoup your CAC investment, let alone get any return on it.  Consider a monthly SaaS company with a $3500 customer acquisition cost, subscription gross margin of 70%, a monthly fee of $150, and 3% monthly churn.  I’ll calculate the ratios and examine the CAC recovery of a 100 customer cohort.

saas fail

While the CPP formula outputs a long 33.3 month CAC Payback Period, reality is far, far worse.  One problem with the CPP formula is that it does not factor in churn and how exposed a cohort is to it — the more chances customers have to not renew during the payback period, the more you need to consider the possibility of non-renewal in your math [1].  In this example, when you properly account for churn, you still have $6 worth of CAC to recover after 30 years!  You literally never get back your CAC.

Soapbox:  this is another case where using a model is infinitely preferable to back-of-the-envelope (BOTE) analysis using SaaS metrics.  If you want to understand the financials of a SaaS company, then build a driver-based model and vary the drivers.  In this case and many others, BOTE analysis fails due to subtle complexity, whereas a well-built model will always produce correct answers, even if they are counter-intuitive.

Such cases aside, the real problem with being too focused on CAC Payback Period is that CPP is a risk metric that tells you nothing about returns.  Companies are in business to get returns, not simply to minimize risk, so to properly analyze a SaaS business we need to look at both.

The Impact of Annual and Multi-Year Prepaid Contracts on CAC Payback Period

The CPP formula outputs a payback period in months, but most enterprise SaaS businesses today run on an annual rhythm.  Despite pricing that is sometimes still stated per-user, per-month, SaaS companies realized years ago that enterprise customers preferred annual contracts and actually disliked monthly invoicing.  Just as MRR is a bit of a relic from the old SaaS days, so is a CAC Payback Period stated in months.

In a one-hundred-percent annual prepaid contract world, the CPP formula should output in multiples of 12, rounding up for all values greater than 12.  For example, if a company’s CAC Payback Period is notionally 13 months, in reality it is 24 months because the leftover 1/13 of the cost isn’t collected until the a customer’s second payment at month 24.  (And that’s only if the customer chooses to renew — see above discussion of churn.)

In an annual prepaid world, if your CAC Payback Period is less than or equal to 12 months, then it should be rounded down to one day because you are invoicing the entire year up-front and at-once.  Even if the formula says the CPP is notionally 12.0 months, in an annual prepaid world your CAC investment money is at risk for just one day.

So, wait a minute.  What is the actual CAC Payback Period in this case?  12.0 months or 1 day?  It’s 1 day.

Anyone who argues 12.0 months is forgetting the point of the metric.  Payback periods are risk metrics and measured by the amount of time it takes to get your investment back [2].  If you want to look at S&M efficiency, look at the CAC ratio.  If you want to know about the efficiency of running the SaaS service, look at subscription gross margins.  If you want to talk about lifetime value, then look at LTV/CAC.  CAC Payback Period is a risk metric that measures how long your CAC investment is “on the table” before getting paid back.  In this instance the 12 months generated by the standard formula is incorrect because the formula misses the prepayment and the correct answer is 1 day.

A lot of very smart people get stuck here.  They say, “yes, sure, it’s 1 day – but really, it’s not.  It’s 12 months.”  No.  It’s 1 day.

If you want to look at something other than payback, then pick another metric.  But the CPP is 1 day.  You asked how long it takes for the company to recoup the money it spends to acquire a customer.  For CPPs less than or equal to 12 in a one-hundred percent annual prepaid world, the answer is one day.

It gets harder.  Imagine a company that sells in a sticky category (e.g., where typical lifetimes may be 10 years) and thus is a high-consideration purchase where prospective customers do deep evaluations before making a decision (e.g., ERP).  As a result of all that homework, customers are happy to sign long contracts and thus the company does only 3-year prepaid contracts.  Now, let’s look at CAC Payback Period.  Adapting our rules above, any output from the formula greater than 36 months should be rounded up in multiples of 36 months and, similarly, any output less than or equal to 36 months should be rounded down to 1 day.

Here we go again.  Say the CAC Payback Period formula outputs 33 months.  Is the real CPP 33 months or 1 day?  Same argument.  It’s 1 day.  But the formula outputs 33 months.  Yes, but the CAC recovery time is 1 day.  If you want to look at something else, then pick another metric.

It gets even harder.  Now imagine a company that does half 1-year deals and half 3-year deals (on an ARR-weighted basis).  Let’s assume it has a CAC ratio of 1.5, 75% subscription gross margins, and thus a notional CAC Payback Period of 24 months.  Let’s see what really happens using a model:

50-50

Using this model, you can see that the actual CAC Payback Period is 1 day. Why?  We need to recoup $1.5M in CAC.  On day 1 we invoice $2.0M, resulting in $1.5M in contribution margin, and thus leaving $0 in CAC that needs to be recovered.

While I have not yet devised general rounding rules for this situation, the model again demonstrates the key point – that the mix of 1-year and 3-year payment structure confounds the CPP formula resulting in a notional CPP of 24 months, when in reality it is again 1 day.  If you want to make rounding rules beware the temptation to treat the average contract duration (ACD) as a rounding multiple because it’s incorrect — while the ACD is 2 years in the above example, not a single customer is paying you at two-year intervals:  half are paying you every year while half are paying you every three.  That complexity, combined with the reality that the mix is pretty unlikely to be 50/50, suggests it’s just easier to use a model than devise a generalized rounding formula.

But pulling back up, let’s make sure we drive the key point home.  The CAC Payback Period is the single most often misunderstood SaaS metric because people forget that payback metrics are about risk, not return, and because the basic formulas – like those for many SaaS metrics – assume a monthly model that simply does not apply in today’s enterprise SaaS world, and fail to handle common cases like annual or multi-year prepaid contracts.

# # #

Notes

[1] This is a huge omission for a metric that was defined in terms of MRR and which thus assumes a monthly business model.  As the example shows, the formula (which fails to account for churn) outputs a CAC payback of 33 months, but in reality it’s never.  Quite a difference!

[2] If I wanted to be even more rigorous, I would argue that you should not include subscription gross margin in the calculation of CAC Payback Period.  If your CAC ratio is 1.0 and you do annual prepaid contracts, then you immediately recoup 100% of your CAC investment on day 1.  Yes, a new customer comes with a future liability attached (you need to bear the costs of running the service for them for one year), but if you’re looking at a payback metric that shouldn’t matter.  You got your money back.  Yes, going forward, you need to spend about 30% (a typical subscription COGS figure) of that money over the next year to pay for operating the service, but you got your money back in one day.  Payback is 1 day, not 1/0.7 = 17 months as the formula calculates.

CFOs: More Strategic Than Ever

I was digging through my reading pile and found this about nine-month-old report by Accenture and Oracle entitled The CFO as Corporate Strategist by Donniel Schulman and David Axson of Accenture.  Those who follow Host Analytics might remember David Axson as he’s spoken at several of our user conferences.  (Note:  the 2015 conference is May 18-21 — save the date!)

The overall theme of the paper is that the traditional “bean counter” positioning of CFOs is as outdated as the hula hoop, with CFOs becoming more strategic over time, and partnering with the CEO to run the company.

Here’s one chart from the report that shows just that:

cfo influence

We definitely seeing this trend with our customers at Host Analytics.

As I’ve always said, “CEOs live in the future,” so if CFOs want to partner with them, they are going to de-emphasize a lot of their backwards-looking role and join their CEOs in the future.  This means automating and delegating backwards-looking functions like consolidations and reporting.  And it means getting more involved with both financial planning & analysis (FP&A) and their cousins in the various “ops” teams springing up around the organization — e.g., salesops — who also do lot of planning, modeling, and scenario building.

Why, as CEO, I Love Driver-Based Planning

While driver-based planning is a bit of an old buzzword (the first two Google hits date to 2009 and 2011 respectively), I am nevertheless a huge fan of driver-based planning not because the concept was sexy back in the day, but because it’s incredibly useful.  In this post, I’ll explain why.

When I talk to finance people, I tend to see two different definitions of driver-based planning:

  • Heavy in detail, one where you build a pretty complete bottom-up budget for an organization and play around with certain drivers, typically with a strong bias towards what they have historically been.  I would call this driver-based budgeting.
  • Light in detail where you struggle to find the minimum set of key drivers around which you can pretty accurately model the business and where drivers tend to be figures you can benchmark in the industry.  I call this driver-based modeling.

While driver-based budgeting can be an important step in building an operating plan, I am actually bigger fan of driver-based modeling.  Budgets are very important, no doubt.  We need them to run plan our business, align our team, hold ourselves accountable for spending, drive compensation, and make our targets for the year.  Yes, a good CEO cares about that as a sine qua non.

But a great CEO is really all about two things:

  • Financial outcomes (and how they create shareholder value)
  • The future (and not just next year, but the next few)

The ultimate purpose of driver-based models is to be able answer questions like what happens to key financial outcomes like revenue growth, operating margins, and cashflow given set of driver values.

I believe some CEOs are disappointed with driver-based planning because their finance team have been showing them driver-based budgets when they should have been showing them driver-based models.

The fun part of driver-based modeling is trying to figure out the minimum set of drivers you need to successfully build a complete P&L for a business.  As a concrete example I can build a complete, useful model of a SaaS software company off the following minimum set of drivers

  • Number and type of salesreps
  • Quota/productivity for each type
  • Hiring plans for each type
  • Deal bookings mix for each (e.g., duration, prepayments, services)
  • Intra-quarter bookings linearity
  • Services margins
  • Subscription margins
  • Sales employee types and ratios (e.g., 1 SE per 2 salesreps)
  • Marketing as % of sales or via a set of funnel conversion assumptions (e.g., responses, MQLs, oppties, win rate, ASP)
  • R&D as % of sales
  • G&A as % of sales
  • Renewal rate
  • AR and AP terms

With just those drivers, I believe I can model almost any SaaS company.  In fact, without the more detailed assumptions (rep types, marketing funnel), I can pretty accurately model most.

Finance types sometimes forget that the point of driver-based modeling is not to build a budget, so it doesn’t have to be perfect.  In fact, the more perfect you make it, the heavier and more complex it gets.  For example, intra-quarter bookings linearity (i.e., % of quarterly bookings by month) makes a model more accurate in terms of cash collections and monthly cash balances, but it also makes it heavier and more complex.

Like each link in Marley’s chains, each driver adds to the weight of the model, making it less suited to its ultimate purpose.  Thus, with the additional of each driver, you need to ask yourself — for the purposes of this model, does it add value?  If not, throw it out.

One of the most useful models I ever built assumed that all orders came in on the last day of quarter.  That made building the model much simpler and any sales before the last day of the quarter — of which we hope there are many — become upside to the conservative model.

Often you don’t know in advance how much impact a given driver will make.  For example, sticking with intra-quarter bookings linearity, it doesn’t actually change much when you’re looking at quarter granularity a few years out.  However, if your company has a low cash balance and you need to model months, then you should probably keep it in.  If not, throw it out.

This process makes model-building highly iterative.  Because the quest is not to build the most accurate model but the simplest, you should start out with a broad set of drivers, build the model, and then play with it.  If the financial outcomes with which you’re concerned (and it’s always a good idea to check with the CEO on which these are — you can be surprised) are relatively insensitive to a given driver, throw it out.

Finance people often hate this both because they tend to have “precision DNA” which runs counter to simplicity, and because they have to first write and then discard pieces of their model, which feels wasteful.  But if you remember the point — to find the minimum set of drivers that matter and to build the simplest possible model to show how those key drivers affect financial outcomes — then you should discard pieces of the model with joy, not regret.

The best driver-based models end up with drivers that are easily benchmarked in the industry.  Thus, the exercise becomes:  if we can converge to a value of X on industry benchmark Y over the next 3 years, what will it do to growth and margins?  And then you need to think about how realistic converging to X is — what about your specific business means you should converge to a value above or below the benchmark?

At Host Analytics we do a lot of driver-based modeling and planning internally.  I can say it helps me enormously as CEO think about industry benchmarks, future scenarios, and how we create value for the shareholders.  In fact, all my models don’t stop at P&L, they go onto implied valuation given growth/profit and ultimately calculate a range of share prices on the bottom line.

The other reason I love driver-based planning is more subtle.  Much as number theory helps you understand the guts of numbers in mathematics, so does driver-based modeling help you understand the guts of your business — which levers really matter, and how much.

And that knowledge is invaluable.